Key Takeaways
- Core idea: Flood risk assessment combines flood hazard, exposure, vulnerability, and consequences to estimate who or what may be affected by flooding.
- Engineering use: Engineers use it to support floodplain planning, infrastructure design, mitigation projects, emergency access planning, and risk communication.
- What controls it: Rainfall, terrain, streamflow assumptions, hydraulic controls, asset exposure, vulnerability, and consequence severity control the final risk picture.
- Practical check: A mapped flood zone is not the same as complete flood safety; local drainage, culverts, debris, future development, and shallow overland flow can shift real risk.
Table of Contents
Introduction
Flood risk assessment is the engineering process of estimating how likely flooding is, how severe it could be, and what people, buildings, roads, utilities, or environmental areas may be affected. It connects flood hazard modeling with exposure, vulnerability, and consequences so communities and project teams can make better planning, design, and mitigation decisions.
The Core of Flood Risk
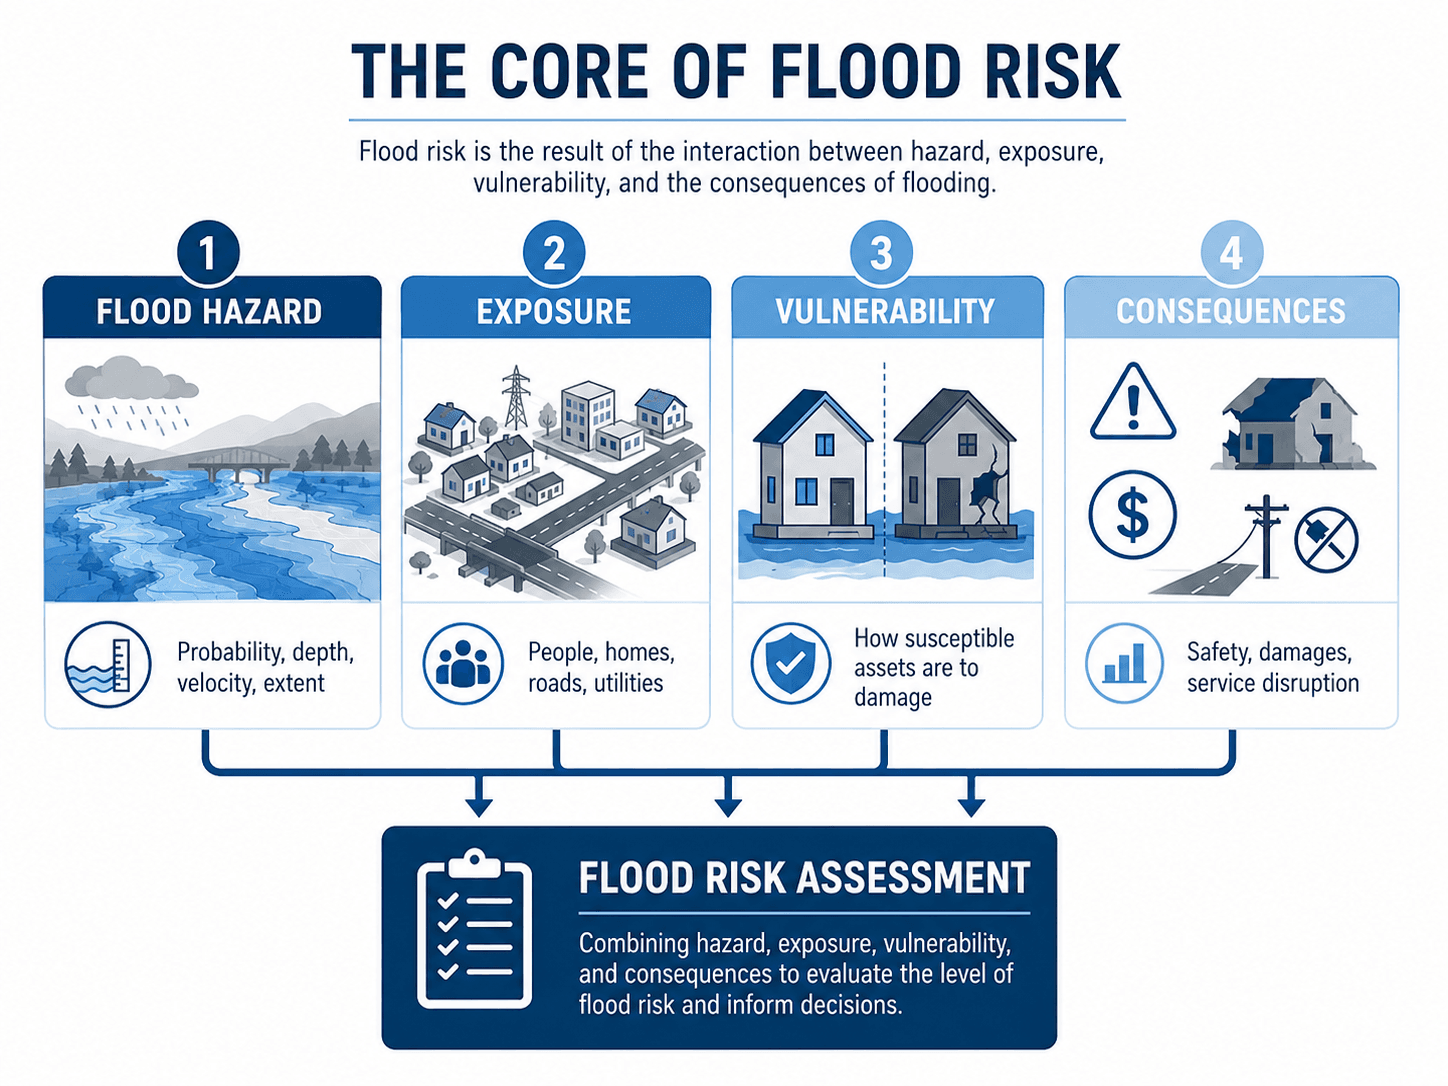
The most important idea is that flood risk increases when a severe flood hazard overlaps with valuable, vulnerable, or critical assets. A deep flood in an undeveloped floodplain may be a hazard, but the same flood depth through a neighborhood, road crossing, hospital access route, or electrical substation becomes a higher-risk condition.
What Is Flood Risk Assessment?
A flood risk assessment evaluates the likelihood and impact of flooding for a site, watershed, community, or infrastructure system. In water resources engineering, it usually combines hydrologic analysis, hydraulic modeling, terrain data, flood mapping, asset inventories, and consequence evaluation.
The key difference from a simple flood map is that a risk assessment asks more than “where does water go?” It also asks who is affected, what is damaged, how critical the affected assets are, and what decisions should follow. That makes it useful for floodplain management, stormwater planning, bridge and road design, emergency access planning, utility resilience, and flood mitigation projects.
This relationship is conceptual, not a single universal equation. It helps engineers organize the problem: flood hazard describes the physical event, exposure identifies what is in the flood area, vulnerability describes susceptibility to damage, and consequence describes the resulting loss or disruption.
Flood Hazard vs Flood Risk
Flood hazard and flood risk are often used interchangeably, but they are not the same. Flood hazard describes the physical flood condition. Flood risk describes the impact of that condition on people, property, infrastructure, services, or the environment.
| Concept | What it describes | Engineering implication |
|---|---|---|
| Flood hazard | Probability, depth, velocity, duration, water surface elevation, and flood extent. | Defines the physical loading condition and maps where floodwater may occur. |
| Exposure | Buildings, roads, utilities, people, crops, critical facilities, and ecosystems located in the flood area. | Identifies what may be affected and where damage or disruption could occur. |
| Vulnerability | How susceptible exposed assets are to damage, service loss, erosion, isolation, or functional failure. | Separates low-impact exposure from assets that may fail, flood, erode, or lose function. |
| Consequence | Economic damage, life-safety risk, access loss, environmental impact, and service disruption. | Helps prioritize mitigation and communicate why one flooded location may matter more than another. |
A floodplain with deep water but no exposed assets may have high hazard and low consequence. A shallow flood across a hospital access road or electrical substation may have lower depth but much higher practical risk.
Flood Risk Assessment vs Floodplain Mapping
Floodplain mapping and flood risk assessment are related, but they answer different questions. Floodplain mapping usually focuses on where floodwater is expected to go for selected events. Flood risk assessment uses that information, then evaluates what is exposed, how vulnerable it is, and what consequences may follow.
| Question | Floodplain mapping | Flood risk assessment |
|---|---|---|
| What is the main purpose? | Define mapped flood hazard areas, elevations, and boundaries. | Evaluate likelihood, exposure, vulnerability, consequences, and decisions. |
| What does it usually show? | Flood extents, flood zones, base flood elevations, or inundation boundaries. | Flood depths, velocities, affected assets, service disruption, damage potential, and mitigation priorities. |
| What can it miss? | Local stormwater flooding, future development, small culverts, shallow overland flow, and site-specific drainage problems. | Risk can still be understated if asset data, vulnerability assumptions, or local field conditions are incomplete. |
| How is it used? | Regulatory screening, floodplain management, insurance awareness, and planning context. | Engineering design, capital planning, emergency access, critical infrastructure review, and mitigation selection. |
A practical assessment may use existing flood maps as a starting point, but it should not stop there. Local drainage complaints, high-water marks, maintenance records, culvert conditions, and future watershed changes can all reveal risk that a mapped flood boundary does not fully communicate.
Types of Flooding Considered in a Flood Risk Assessment
A strong assessment identifies the flood sources that actually matter for the site or community. The right method for a river floodplain may not capture local storm drain flooding, coastal surge, or a backwater condition at a road crossing.
| Flood source | What causes it | Why it matters in assessment |
|---|---|---|
| Riverine flooding | A stream or river exceeds channel capacity and inundates the floodplain. | Often requires watershed hydrology, hydraulic routing, floodplain terrain, and bridge or culvert representation. |
| Pluvial or urban flooding | Rainfall exceeds local drainage capacity before reaching a major river or mapped floodplain. | Can occur outside mapped flood zones and may be controlled by inlets, pipes, curbs, low points, and overland flow paths. |
| Flash flooding | Rapid runoff response in steep, small, or highly impervious watersheds. | Creates short warning time and may pose high safety risk even when inundation duration is brief. |
| Coastal flooding | Storm surge, tides, waves, coastal water levels, and sea level effects. | Requires coastal boundary conditions and may combine with rainfall runoff or river flooding. |
| Backwater or tailwater flooding | Downstream water levels restrict drainage or raise upstream water surfaces. | Can increase flood depths near outfalls, bridges, culverts, confluences, or low-gradient channels. |
| Levee, dam, or embankment failure | Overtopping, breach, structural failure, or operational failure of a flood-control feature. | May be low probability but high consequence, especially where warning time is short and exposure is high. |
| Compound flooding | Multiple flood drivers occur together, such as rainfall, river flooding, and high downstream water levels. | Single-source analysis may understate risk when drainage systems are affected by coincident conditions. |
What Controls Flood Risk?
Flood risk is controlled by both the flood mechanics and the value or criticality of what lies in the flood area. In engineering review, the most important controls are usually the storm loading, watershed response, floodplain conveyance, hydraulic restrictions, asset exposure, and consequence severity.
| Control | Why it matters | Engineering implication |
|---|---|---|
| Rainfall intensity and duration | Controls the volume and timing of runoff reaching streams, channels, and drainage systems. | Short intense storms may drive local drainage flooding while longer storms may control riverine flooding. |
| Antecedent moisture and storage | Wet soils, full ponds, and saturated floodplains reduce available storage before the storm begins. | Two storms with the same rainfall depth can produce different runoff depending on pre-storm conditions. |
| Impervious cover and land use | Urban development increases runoff volume and can shorten the time to peak flow. | Future-condition analysis may be needed when watershed development is expected. |
| Channel and floodplain conveyance | Roughness, vegetation, sediment, overbank storage, and channel geometry influence water levels. | Small conveyance changes can shift flood depths and extents in flat or constrained areas. |
| Bridges, culverts, and embankments | Structures can restrict flow, create backwater, overtop, or divert water into unexpected paths. | These features often control flood risk at roads, rail crossings, and developed corridors. |
| Depth and velocity | Depth relates to damage and access; velocity relates to safety, erosion, scour, and structural loading. | Risk interpretation should consider both, not just inundation extent. |
| Asset criticality | Some exposed assets create higher consequences than others, even at similar flood depths. | Hospitals, evacuation routes, utilities, pump stations, and emergency services need special attention. |
How Flood Risk Assessment Works
A good flood risk assessment moves from physical flood generation to practical decision-making. The workflow begins with the study boundary and flood sources, then develops hydrology, hydraulic modeling, inundation outputs, exposure analysis, consequence estimates, and mitigation recommendations.
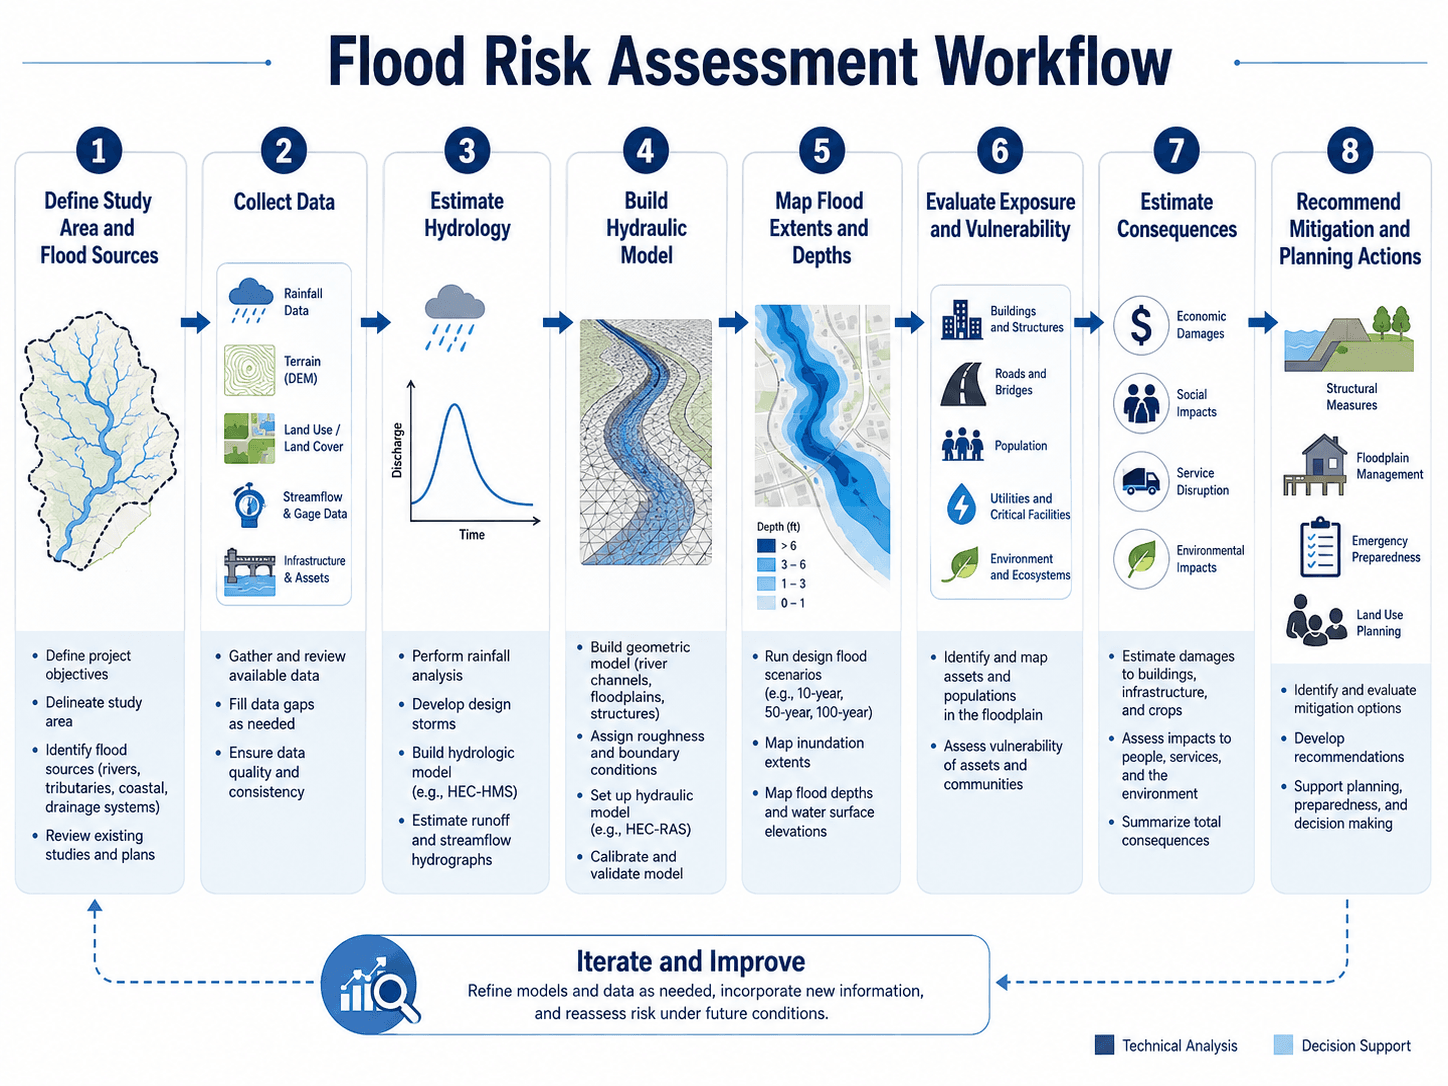
1. Define the Study Area and Flood Sources
The first step is to define what flooding mechanisms are relevant. Riverine flooding, coastal flooding, local stormwater flooding, dam or levee failure, backwater, tailwater, and compound events may require different data and modeling approaches.
2. Collect Rainfall, Terrain, Streamflow, and Asset Data
The assessment needs reliable rainfall records, stream gage data, land cover, soil information, terrain data, drainage structures, bridges, culverts, buildings, roads, utilities, and critical facilities. If the terrain or structure data is wrong, the flood depth and exposure outputs may be misleading.
3. Estimate Hydrology and Model Hydraulics
Hydrology estimates the flood flow or hydrograph entering the system. Hydraulics estimates how that water moves through channels, floodplains, bridges, culverts, and overbank areas to estimate water levels, depths, velocities, and inundation extents. For more background on rainfall, runoff, and streamflow response, see Hydrology.
4. Map Flood Extents, Depths, and Consequences
Flood mapping converts model results into usable outputs: inundation limits, depth grids, water surface elevations, velocities, affected structures, road closures, and potential damage zones. The risk assessment becomes valuable when those outputs are interpreted for decisions, not just plotted on a map.
Screening-Level vs Detailed Flood Risk Assessment
Not every flood risk assessment needs the same level of detail. A planning team may need a screening study to rank problem areas, while a bridge replacement, subdivision review, or mitigation design may require survey data, detailed hydraulic modeling, and sensitivity checks.
| Assessment level | Used for | Typical methods |
|---|---|---|
| Screening-level assessment | Early planning, grant scoping, portfolio ranking, and identifying areas that need deeper study. | Existing flood maps, GIS overlays, historic flood records, terrain review, complaint data, and asset screening. |
| Planning-level assessment | Capital improvement planning, mitigation alternative comparison, and community risk communication. | Approximate hydrology, hydraulic modeling, depth grids, exposure analysis, and consequence screening. |
| Detailed engineering assessment | Design, permitting, infrastructure replacement, floodplain revisions, and high-consequence decisions. | Survey, calibrated or reviewed H&H models, structure data, sensitivity checks, uncertainty review, and documented assumptions. |
The level of detail should match the decision. A screening map may be enough to identify candidate mitigation areas, but it should not be treated as final design evidence for a bridge, culvert, levee, or development approval.
Key Data Inputs for Flood Risk Assessment
Flood risk results are only as credible as the data used to build them. A model with a clean map but weak terrain, old hydrology, missing culverts, or incomplete asset data can create false confidence.
| Input | Why it matters | Engineering implication |
|---|---|---|
| Rainfall and design storm data | Controls the volume and intensity of runoff entering streams, channels, and drainage systems. | Outdated rainfall depths can understate flood peaks, especially in areas with updated precipitation-frequency data. |
| Streamflow and gage records | Provide observed evidence of how the watershed responds to storms. | Useful for calibration, flood frequency analysis, and checking whether model results are reasonable. |
| Terrain, LiDAR, or DEM data | Defines floodplain elevations, flow paths, low points, overbanks, and storage areas. | Small vertical errors can shift mapped flood extents, especially in flat terrain. |
| Bridges, culverts, channels, and levees | Control conveyance, backwater, flow restriction, overtopping, and local flood depth. | Missing or simplified structures can produce unrealistic water surface elevations and depths. |
| Land use and impervious cover | Influence runoff volume, peak timing, infiltration, and storage. | Future development or urbanization can increase flood risk even if the mapped floodplain has not yet changed. |
| Buildings, roads, utilities, and critical facilities | Define exposure and the practical consequences of flooding. | Risk cannot be prioritized correctly unless the affected assets are mapped accurately. |
| Historic flood observations | Show where water has actually gone during past storms. | High-water marks, photos, road closure records, and maintenance logs can reveal issues not visible in model geometry. |
How to Read Flood Risk Outputs
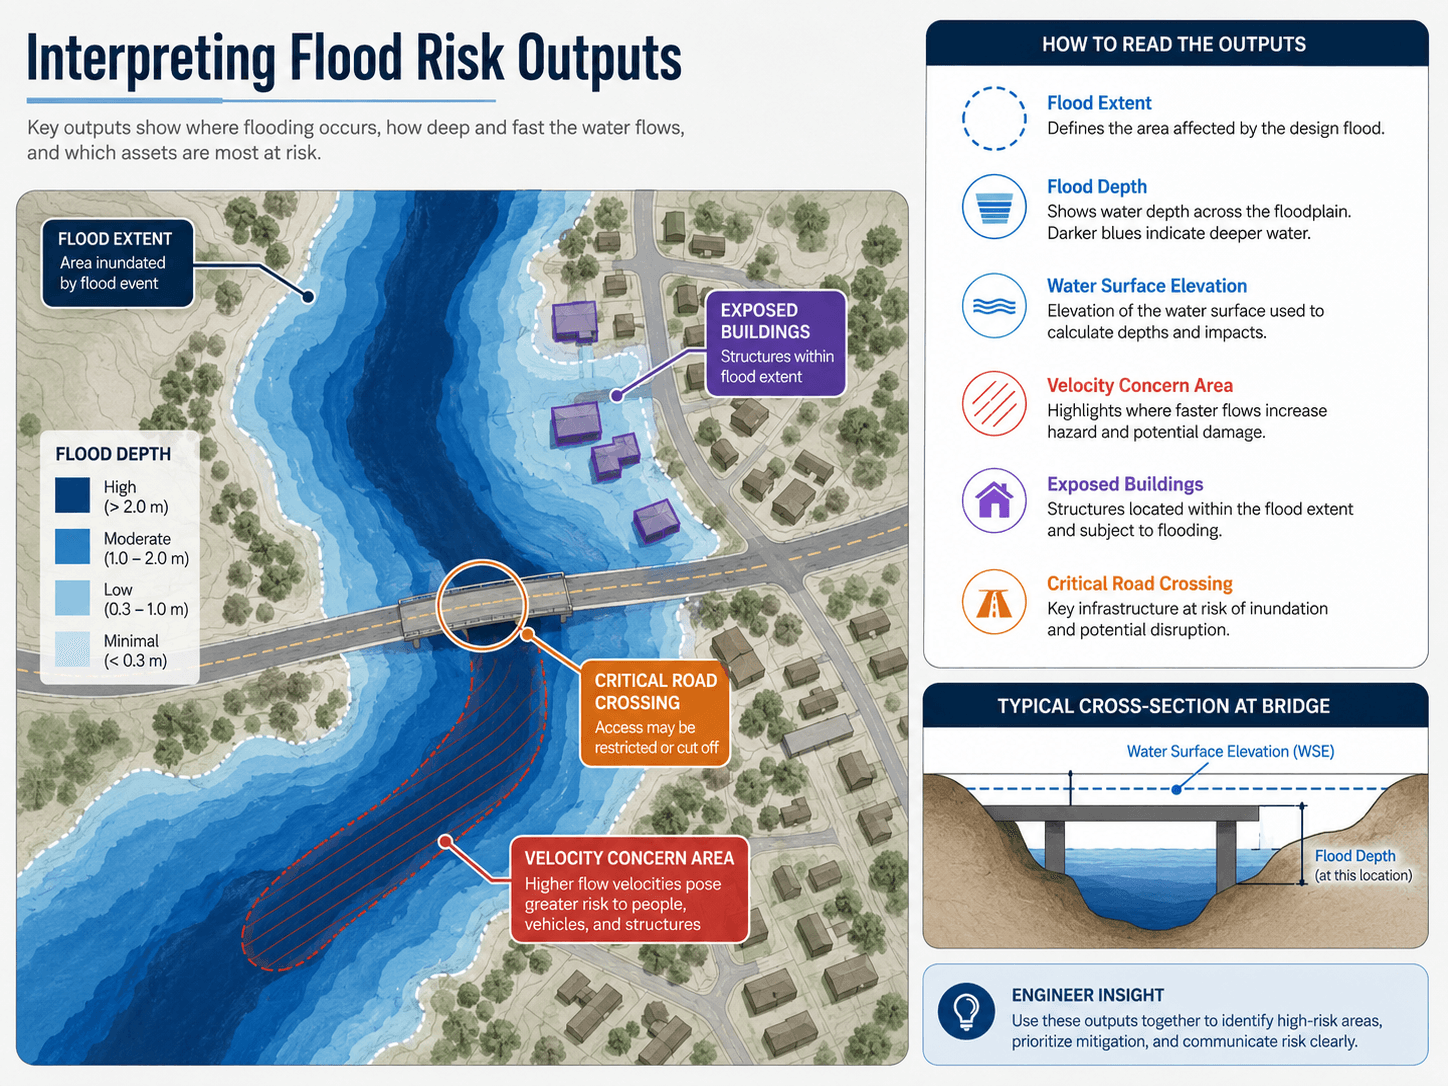
Flood risk assessment outputs should be read as a connected set, not as isolated maps. Flood extent shows where water reaches, depth shows severity, velocity shows force and safety concern, and exposed assets show where the flood becomes a community or infrastructure problem.
| Output | Good for | Not enough for |
|---|---|---|
| Flood extent | Showing the area affected by a selected flood event or scenario. | Estimating damage severity without depth, velocity, and asset vulnerability. |
| Flood depth | Understanding damage potential, building exposure, road passability, and floodproofing needs. | Evaluating flow force, scour, or safety where velocity is important. |
| Velocity | Identifying erosion, scour, vehicle safety, pedestrian hazard, and high-energy flow paths. | Estimating building damage without depth and vulnerability context. |
| Water surface elevation | Comparing flood levels to finished floors, road crowns, bridge decks, levees, and freeboard criteria. | Communicating exposure by itself unless tied to ground elevation and asset data. |
| Exposed asset count | Screening how many buildings, roads, utilities, or facilities intersect the flood extent. | Determining consequence without vulnerability, depth, criticality, and service disruption analysis. |
| Consequence estimate | Prioritizing mitigation alternatives and communicating practical impact. | Replacing engineering judgment when assumptions and uncertainty are not documented. |
Methods Used in Flood Risk Assessment
Flood risk assessment can range from a screening-level GIS study to a detailed hydrologic and hydraulic modeling effort. The right method depends on the decision being made, the scale of the study, the available data, and how sensitive the result is to local site conditions.
Flood Frequency and Annual Exceedance Probability
Many flood studies describe events using annual exceedance probability, or AEP. A 1 percent AEP flood has a 1 percent chance of being equaled or exceeded in a given year. It is often called the 100-year flood, but that phrase can be misleading because it does not mean the event occurs only once every 100 years.
- p Annual exceedance probability for the selected flood event, such as 0.01 for a 1 percent annual chance flood.
- n Number of years in the exposure period, such as a 30-year mortgage, planning horizon, or asset life.
For a 1 percent annual chance flood over a 30-year exposure period:
This means a site exposed for 30 years has about a 26 percent chance of experiencing at least one 1 percent annual chance event, assuming the annual probability stays constant. That is why “100-year flood” should not be interpreted as a flood that only happens once every 100 years.
Hydrologic and Hydraulic Modeling
Hydrologic models estimate runoff, peak flow, and hydrograph timing. Hydraulic models route that flow through channels, bridges, culverts, floodplains, and urban drainage features to estimate water levels, depths, velocities, and inundation extents. For broader modeling context, see Water Resources Modeling.
GIS-Based Exposure and Consequence Analysis
Once flood outputs are mapped, GIS analysis can intersect flood depths with buildings, roads, utilities, land use, parcels, critical facilities, and population data. This is where the assessment moves from “flooding may occur here” to “these assets, services, or communities are at risk.”
Common Deliverables in a Flood Risk Assessment
A strong assessment should produce more than one map. The deliverables should help reviewers understand the flood source, the methods used, the areas affected, the severity of flooding, the exposed assets, the uncertainty, and the decisions that follow.
| Deliverable | What it shows | Why it helps |
|---|---|---|
| Study area and flood source map | Watershed boundary, stream network, drainage area, flood source, and affected corridor. | Confirms the assessment is looking at the right physical system. |
| Flood hazard map | Flood extent, flood zone, inundation boundary, or scenario footprint. | Shows where floodwater is expected to reach. |
| Depth grid or depth map | Water depth above ground surface across the floodplain. | Supports damage, safety, access, and mitigation screening. |
| Water surface elevation profile | Modeled floodwater elevations along a stream, road crossing, or project corridor. | Supports freeboard, bridge, culvert, road, and finished-floor comparisons. |
| Velocity or hazard zone map | Areas where faster flow may create safety, erosion, or scour concerns. | Identifies locations where depth alone understates the hazard. |
| Exposed asset table | Buildings, roads, utilities, critical facilities, parcels, or populations inside flood extents. | Converts mapped flooding into practical risk information. |
| Assumptions and limitations summary | Key data sources, model assumptions, sensitivity items, and known gaps. | Prevents overconfidence and helps future reviewers understand the result. |
| Mitigation or planning recommendations | Potential actions such as storage, conveyance, elevation, floodproofing, warning, or land-use changes. | Turns the assessment into a decision-support product. |
Senior Engineer Flood Risk Assessment Review Checklist
The most useful flood risk assessments are reviewable. A senior engineer should be able to trace the result from rainfall and terrain assumptions to flood depths, exposed assets, and mitigation recommendations.
Start with the decision being supported, then check whether the study boundary, hydrology, hydraulic model, terrain, structures, flood outputs, exposure inventory, vulnerability assumptions, uncertainty, and recommendations are consistent with that decision.
| Review check | What to look for | Why it matters |
|---|---|---|
| Study boundary | Includes upstream controls, downstream boundary effects, local drainage inputs, and affected assets. | A boundary that is too narrow can miss backwater, bypass flow, tailwater, or downstream impacts. |
| Rainfall and flow assumptions | Uses appropriate design storms, frequency data, gage information, and watershed assumptions. | Flood risk can be underreported if peak flows or hydrograph timing are not defensible. |
| Terrain and structures | Checks DEM quality, bridge openings, culvert sizes, levees, walls, road embankments, and channel geometry. | Small geometric errors can create large changes in flood depth and mapped extent. |
| Hydraulic reasonableness | Reviews water surface profiles, abrupt depth changes, velocity spikes, ineffective areas, and overtopping paths. | The model may run successfully while still producing physically unrealistic results. |
| Exposure inventory | Confirms buildings, roads, utilities, critical facilities, and access routes are mapped correctly. | Risk prioritization fails if key assets are missing from the analysis. |
| Consequence interpretation | Separates shallow nuisance flooding from life-safety, access, utility, structural, or economic impacts. | Decision-makers need to know which risks are tolerable and which require action. |
| Uncertainty and sensitivity | Identifies which assumptions most affect mapped depths, extents, or consequences. | Transparent uncertainty prevents overconfidence in a single flood boundary line. |
Example: Reading Risk at a Road Crossing
Consider a small community where a two-lane road crosses a creek. A detailed assessment shows that the 1 percent annual chance flood overtops the bridge approach, creates shallow flooding in nearby yards, and produces a faster flow zone near the bridge opening.
Example Inputs and Results
| Assessment item | Example result | Risk interpretation |
|---|---|---|
| Road depth during 1 percent AEP event | 1.2 ft of water over the low road approach | Vehicle access may be unsafe or blocked during the design flood scenario. |
| Nearby residential flood depth | 0.4 to 0.8 ft around 18 homes | Property exposure exists, but damage severity may depend on finished-floor elevations and duration. |
| Velocity near bridge opening | Approximately 5 ft/s in the constricted flow path | Higher velocity increases safety, erosion, and scour concern near the crossing. |
| Critical access role | The road is one of two emergency access routes into the neighborhood | Access disruption may be a higher consequence than shallow yard flooding alone. |
What the Engineering Decision Might Be
If the main consequence is recurring access loss, a mitigation project may focus on raising the road approach, improving bridge conveyance, adding overflow capacity, or developing an alternate route. If the main consequence is building damage, elevation, floodproofing, acquisition, or land-use planning may be more appropriate.
In this example, the highest-priority risk may not be the deepest water next to a home. It may be the combination of moderate depth, high velocity, and loss of emergency access at the road crossing.
Engineering Judgment and Field Reality
Flood risk assessment requires more than running a model and exporting a map. Field evidence often reveals problems that simplified datasets miss: blocked culverts, undersized driveway pipes, debris at bridge openings, low road crowns, localized ponding, erosion scars, informal drainage paths, and recent development that changed runoff patterns.
A crisp flood boundary can look precise, but the actual risk may depend on small site details such as a clogged culvert, a low driveway entrance, a raised road embankment, or a downstream obstruction. Field review is often what separates a useful assessment from a polished but fragile map.
Experienced reviewers also look for consistency between flood depth, flow direction, topography, and observed problem areas. If the model says water flows uphill, ignores a known overtopping location, or misses a frequently flooded road, the issue should be resolved before the results are used for major decisions.
When This Breaks Down
Flood risk assessment becomes less reliable when the data, assumptions, or decision context do not match the real flood problem. The biggest issue is often not the method itself, but using the method at a level of precision it cannot support.
- Outdated rainfall assumptions: Older precipitation data may understate storm intensity, especially for infrastructure with a long design life.
- Weak terrain data: Coarse DEMs can miss curbs, levees, berms, small channels, road crowns, and low openings that control shallow flooding.
- Missing hydraulic controls: Bridges, culverts, debris, gates, levees, and embankments can dominate water levels and should not be ignored.
- Overreliance on mapped zones: A regulatory flood zone is not a complete description of all possible flood risk.
- No future-condition check: Land-use change, watershed development, channel changes, sea level rise, or altered rainfall patterns can change risk over time.
- Poor consequence framing: A model may show flooding accurately but still fail to explain why a road closure, utility outage, or critical facility exposure matters.
Common Mistakes and Practical Checks
The most common flood risk assessment mistakes come from treating a map as the final answer instead of one input to engineering judgment. The practical goal is to understand where flooding occurs, why it occurs, what it affects, and what action is justified.
- Confusing hazard with risk: A flood depth map does not fully describe risk unless exposed assets and consequences are evaluated.
- Ignoring road access: A building may remain dry while emergency access, school access, or utility access is cut off.
- Using a single storm scenario: Multiple flood frequencies can reveal whether damage begins during frequent nuisance events or only during rare extreme events.
- Skipping model calibration checks: Past flood observations, high-water marks, and known problem areas should be compared against model behavior where available.
- Presenting results without uncertainty: Decision-makers should know which assumptions most influence the mapped risk.
Do not assume that “outside the floodplain” means “no flood risk.” Local drainage, intense rainfall, undersized storm systems, bridge backwater, and shallow overland flow can create damaging flood conditions outside a mapped regulatory boundary.
Relevant Manuals, Data Sources, and Design References
Flood risk assessment often sits between engineering modeling, regulatory mapping, community planning, and mitigation decision-making. The best reference depends on whether the project is a local drainage study, FEMA mapping effort, capital improvement plan, bridge design review, or floodplain management decision.
- FEMA Risk MAP: FEMA Risk Mapping, Assessment and Planning program explains how flood hazard mapping and risk communication products support community floodplain management, mitigation planning, and flood risk understanding.
- Project-specific criteria: Local drainage manuals, state DOT requirements, floodplain ordinances, owner criteria, and agency review comments may control how flood risk results are applied to a specific project.
- Engineering use: Engineers use these references to connect flood models, mapped hazards, regulatory requirements, mitigation alternatives, and stakeholder communication into a defensible decision process.
Frequently Asked Questions
A flood risk assessment evaluates how likely flooding is, how severe the flood conditions may be, and what people, buildings, roads, utilities, or environmental areas may be affected. In engineering, it combines flood hazard, exposure, vulnerability, and consequences to support planning, design, mitigation, and risk communication.
Flood hazard describes the physical flood condition, such as probability, extent, depth, velocity, duration, or water surface elevation. Flood risk adds exposure, vulnerability, and consequences, which means it evaluates what is affected and how serious the impacts may be.
No. Mapped flood zones are important screening and regulatory tools, but they do not capture every local drainage problem, intense rainfall event, future land use change, blocked culvert, shallow overland flow path, or site-specific low point. A practical assessment should consider both mapped hazards and local conditions.
Common inputs include rainfall data, streamflow records, terrain or LiDAR data, land cover, soils, drainage infrastructure, bridges, culverts, existing flood maps, historic flood observations, buildings, roads, utilities, and critical facilities. The quality of these inputs strongly affects the credibility of the final flood risk results.
A 100-year flood usually refers to a flood with a 1 percent annual chance of being equaled or exceeded in any given year. It does not mean the flood only happens once every 100 years, and it does not eliminate the possibility of larger or repeated floods within a short period.
A flood risk assessment report commonly includes the study area, flood sources, data inputs, methods, hydrologic and hydraulic assumptions, flood maps, depth and velocity outputs, exposed assets, uncertainty, limitations, consequence interpretation, and recommended mitigation or planning actions.
Summary and Next Steps
Flood risk assessment is the process of connecting flood hazard with exposure, vulnerability, and consequences. It helps water resources engineers move from flood maps to practical decisions about planning, infrastructure protection, emergency access, and mitigation.
The best assessments are transparent about inputs, assumptions, uncertainty, and consequences. A useful result should explain where flooding occurs, how severe it is, which assets are exposed, what damage or disruption is likely, and what action should be considered.
Where to go next
Continue your learning path with related Turn2Engineering resources.
-
Hydrology
Review the rainfall, runoff, streamflow, storage, and watershed processes that control flood generation.
-
Stormwater Management
Learn how urban runoff, drainage systems, detention, and conveyance affect local flood risk.
-
Water Resources Modeling
Explore how engineers use models to simulate flooding, drainage systems, and water infrastructure behavior.