
Direct Answer
Tolerance stack up analysis calculates how dimensional and geometric variation combines across an assembly to control one functional output such as a gap, clearance, interference, endplay, preload, alignment, or fit. A useful stack starts with that functional requirement, traces the physical dimension loop, assigns a direction to every contributor, and then uses a method appropriate to the design risk.
Worst-case analysis determines guaranteed limits from allowable extremes when the model is correct. RSS estimates statistical variation for approximately linear, appropriately modeled random contributors. Monte Carlo simulates the output distribution from specified input distributions and is useful when the response is nonlinear or more complicated. Statistical methods estimate probability or yield; they do not replace drawing limits, process capability evidence, or a correct GD&T/datum model.
How to Build a Tolerance Stack Up Correctly
The primary engineering task is not adding tolerances. It is building the correct mathematical model of the assembly requirement.
A measurable functional requirement such as minimum clearance, maximum interference, endplay range, seal compression, latch engagement, or alignment.
The shortest physical path from the controlling reference or datum through every feature that moves the functional output.
Whether the resulting minimum/maximum range or probability distribution satisfies the requirement with enough manufacturing and measurement margin.
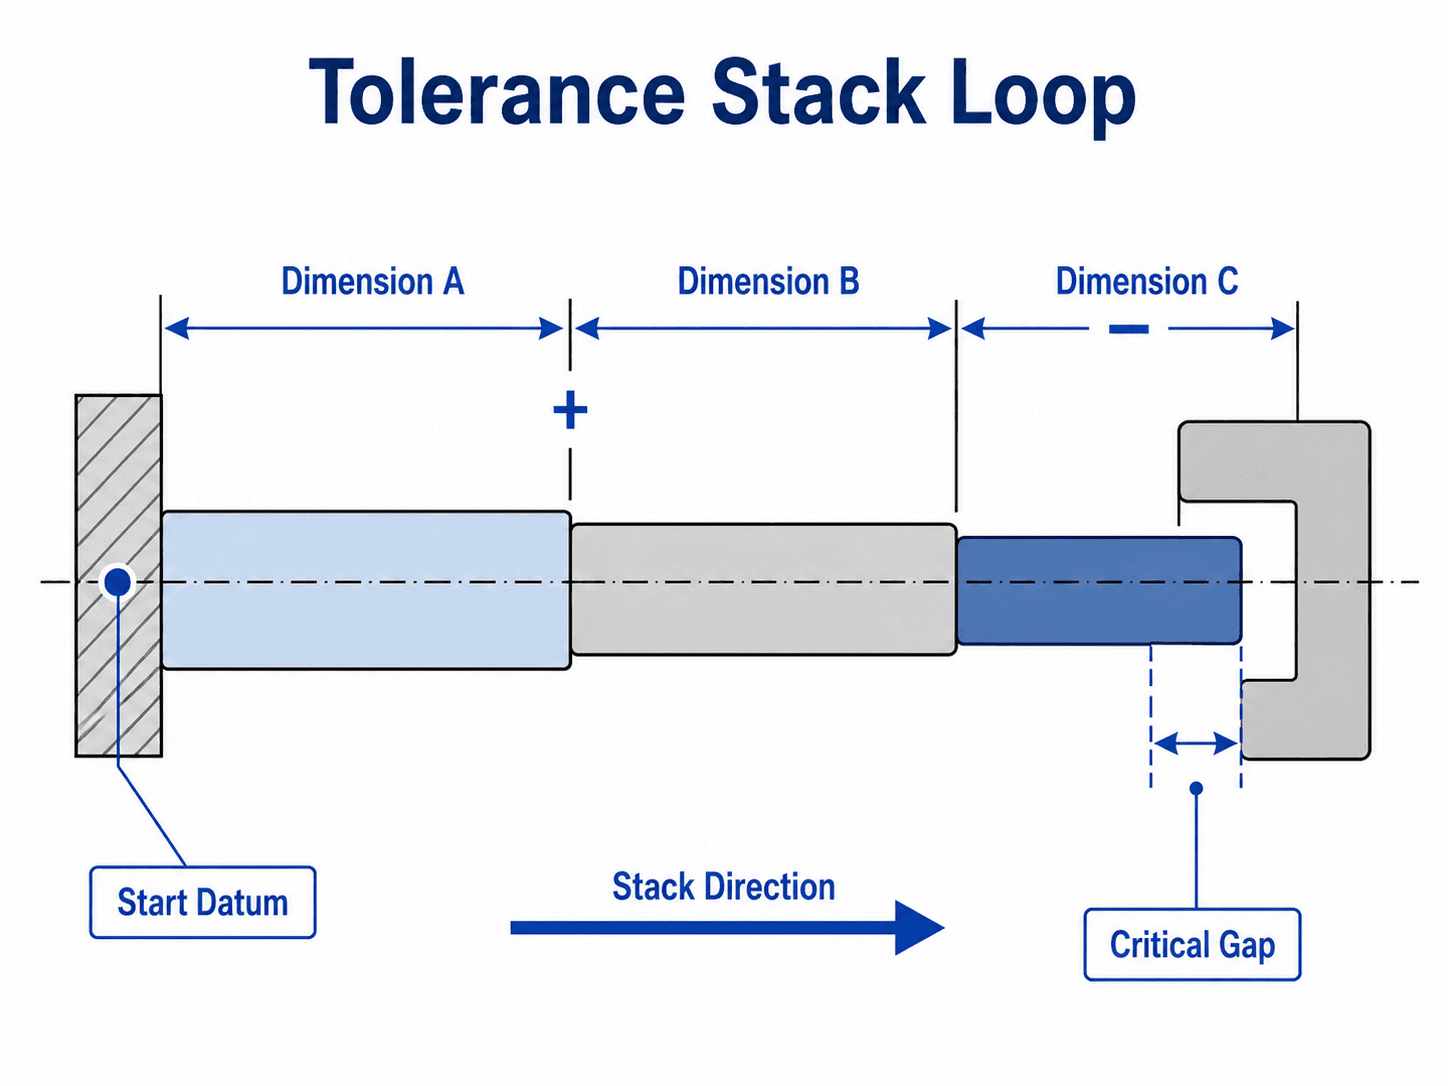
Write the stack as a signed response equation
For a linear 1D stack, write the functional output as a signed sum:
- YThe assembly response being controlled: gap, clearance, endplay, interference, location, or another measurable output.
- XiA contributing dimension, feature location, thickness, offset, or other input variable.
- aiSigned sensitivity coefficient showing how strongly Xi changes Y. In a simple 1D addition/subtraction stack, ai is commonly +1 or −1.
- a0Any fixed offset or constant in the response equation.
Writing the response explicitly prevents one of the most common stack errors: losing the sign. A dimension with a negative coefficient makes the gap smaller as that dimension grows; a positive coefficient makes it larger.
Only include contributors that physically affect the output
| Include | Exclude Unless Functionally Relevant | Reason | Check |
|---|---|---|---|
| Dimensions on the physical path between the reference and output | Cosmetic dimensions outside the path | Only physical contributors can change the functional response. | If the dimension changed alone, would Y move? |
| Coatings, gaskets, shims, washers, snap rings, spacers | Drawing notes that do not alter assembled geometry | Small non-machined contributors can dominate a tight stack. | Does the contributor physically sit in the stack? |
| Relevant GD&T effects | Unrelated form/orientation controls | Geometric variation belongs only when it changes the interface being analyzed. | Can the geometric error move the mating or measured feature? |
| Assembly seating and locating conditions | Manufacturing setup dimensions that disappear after assembly | The model must represent final function rather than one machining setup. | What actually contacts, locates, or stops the assembled parts? |
Swipe horizontally to view all table columns.
Before calculating anything, another engineer should be able to look at the assembly and independently trace the same continuous loop from the reference to the functional output. If the loop is ambiguous, the arithmetic is premature.
Tolerancing-method basis: NISTIR 6223 — Design for Tolerance of Electro-Mechanical Assemblies: An Integrated Approach describes assembly response as a function of input characteristics and surveys worst-case, RSS/linear propagation, nonlinear propagation, numerical integration, and Monte Carlo methods.
Worst-Case vs. RSS vs. Monte Carlo Tolerance Analysis
Use worst-case when the design needs guaranteed limits from specified allowable extremes. Use RSS only when a statistical input model is justified. Use Monte Carlo when distributions, nonlinear response, truncation, correlation, or multiple interacting variables make closed-form methods inadequate.
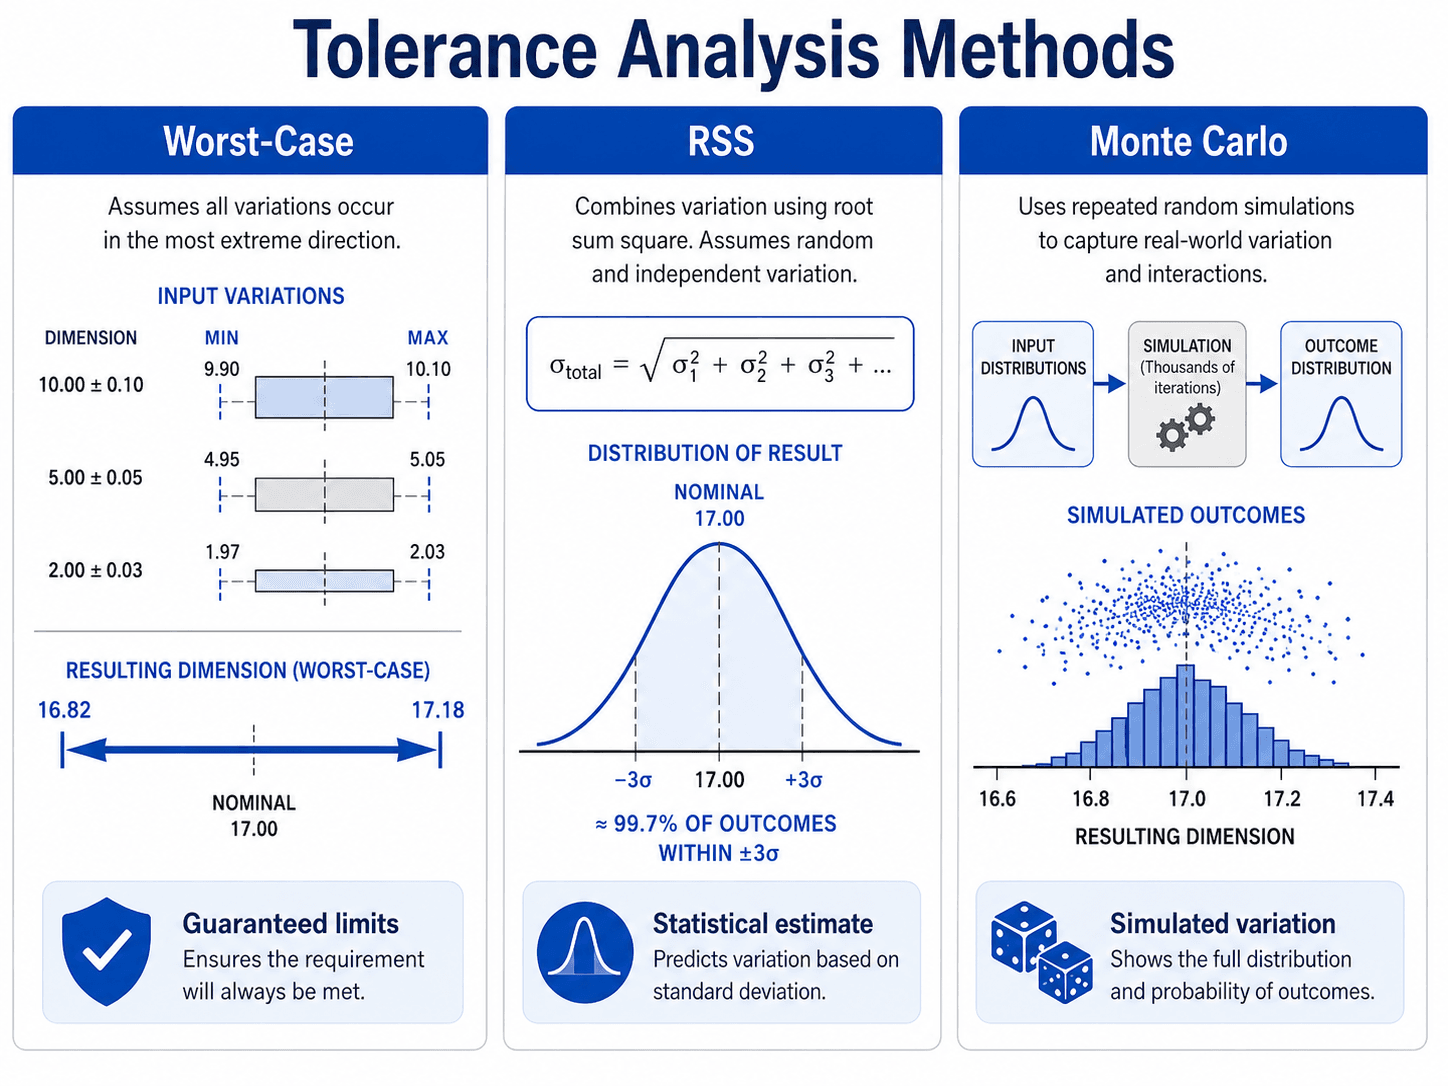
Worst-case: determine the extreme assembly limits
For symmetric ± tolerances in a linear response, the worst-case half-range is:
The minimum and maximum output are then:
For unilateral or asymmetric tolerances, do not force them into a symmetric ± form and lose information. Evaluate the signed response using the actual minimum and maximum limits of each input in the combination that drives the output low or high.
RSS: combine standard deviations, not unexplained drawing tolerances
For an approximately linear response with mutually independent random inputs, NIST gives the variance-propagation basis behind RSS. In standard-deviation form:
This is the technically important distinction. A drawing tolerance ti is a specification limit; a process standard deviation σi describes statistical spread. They are not inherently the same quantity.
You will often see tRSS = √Σti². That shortcut can be internally consistent only when each ±ti is being treated as the same statistical coverage multiple of its process standard deviation, the response is linear, and the contributors satisfy the independence assumptions. State that assumption explicitly instead of presenting drawing tolerance and σ as interchangeable.
Monte Carlo: sample the actual input model
Monte Carlo tolerance analysis repeatedly draws values from specified input distributions, calculates the assembly response for each draw, and then analyzes the resulting output distribution. NIST notes that the method is broadly applicable and particularly useful when simpler analytical methods are inadequate.
Monte Carlo is not automatically more realistic. The simulation only reflects the distributions, correlations, truncation rules, process shifts, and response function you give it. A sophisticated simulation with invented input distributions can be less trustworthy than a simple worst-case stack.
| Method | Question It Answers | Best Fit | Main Assumption / Limitation | Typical Output |
|---|---|---|---|---|
| Worst-case | Can the requirement be met at all specified extremes? | Guaranteed interchangeability, early design, low volume, high consequence of failure. | Conservative because it combines simultaneous unfavorable limits. | Guaranteed min/max for the modeled limits. |
| RSS / linear statistical propagation | What statistical spread is expected from approximately linear independent contributors? | Stable processes with credible means/standard deviations. | Independence, linearity, and valid statistical input model. | Mean and standard deviation / estimated coverage. |
| Monte Carlo | What output distribution results from explicitly modeled input distributions and response behavior? | Nonlinear, truncated, asymmetric, mixed, or complex response models. | Results are only as valid as input distributions, correlations, and simulation model. | Distribution, percentiles, yield, failure probability estimate. |
NIST’s tolerance-design survey explicitly treats statistical tolerance analysis as computing the distribution or moments of an assembly response from input-variable distributions and identifies RSS/linear propagation, nonlinear Taylor methods, numerical integration, and Monte Carlo as distinct approaches.
Worked Tolerance Stack Example: Gap, Worst Case, RSS, and Sensitivity
Three-contributor axial clearance
An assembly has a housing depth H = 25.00 ± 0.10 mm, spacer length S = 18.00 ± 0.08 mm, and cover offset C = 6.50 ± 0.05 mm. The functional requirement is a minimum gap of 0.25 mm. All values below are instructional assumptions.
Write the signed stack equation
The housing increases the gap; the spacer and cover offset reduce it.
Calculate the worst-case minimum gap
Use the smallest positive contributor and the largest negative contributors.
Calculate an illustrative RSS result
For this illustration only, assume every ± drawing tolerance represents the same ±3σ coverage, each process is centered, and the three contributors are independent.
Rank the contributors before tightening tolerances
Sensitivity tells the designer where tolerance improvement buys the most stack margin.
| Contributor | ± Tolerance | Share of Worst-Case Half-Range | Share of RSS Variance* |
|---|---|---|---|
| Housing depth | 0.10 mm | 43.5% | 52.9% |
| Spacer length | 0.08 mm | 34.8% | 33.9% |
| Cover offset | 0.05 mm | 21.7% | 13.2% |
*RSS variance shares use the same equal ±3σ and independence assumptions stated in Step 3.
The same symmetric worst-case stack gives Gmax = 0.50 + 0.23 = 0.73 mm.
The example is valid only if H, S, and C are the complete 1D physical stack and no coatings, seating errors, deformation, or geometric controls materially move the gap.
Decide whether 0.02 mm guaranteed margin is acceptable after measurement uncertainty, thermal behavior, coatings, process drift, and assembly effects are considered.
How GD&T Changes a Tolerance Stack Up
GD&T does not eliminate dimensional variation. It changes how that variation is referenced and bounded, often replacing ambiguous chained locations with controls tied directly to a datum reference frame and functional tolerance zone.
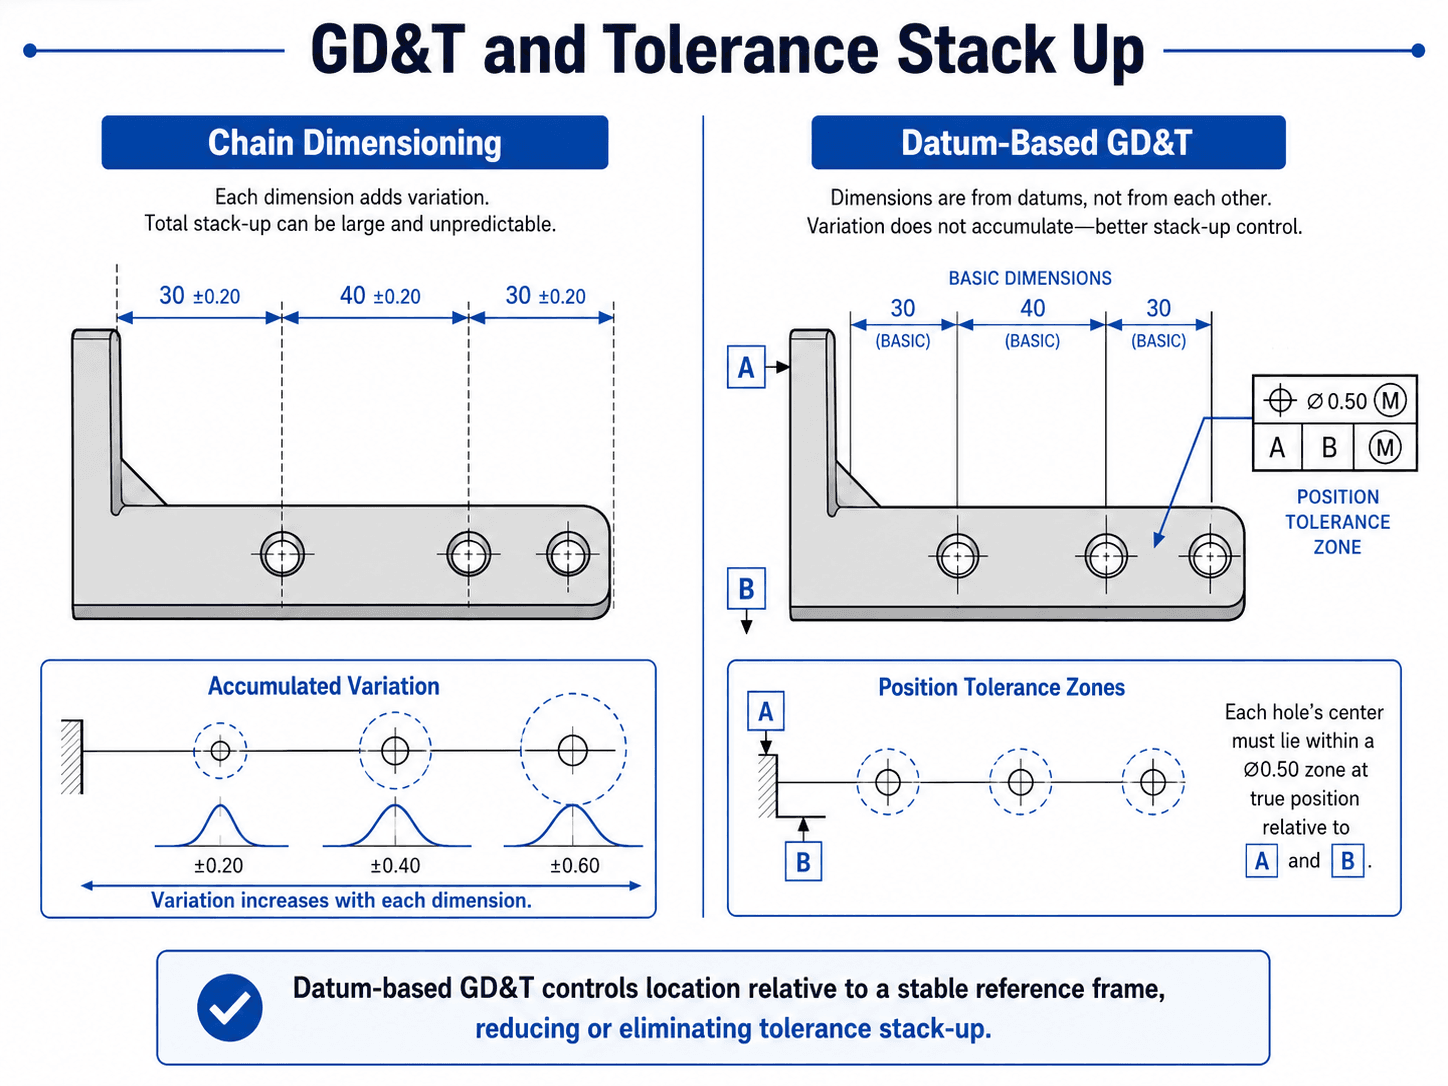
Datum selection changes the stack model
A datum reference frame defines how features are oriented and located for design interpretation. If the stack assumes one functional datum scheme while inspection or assembly seats the part differently, the calculation can be mathematically correct and physically irrelevant.
Position is not a simple ± coordinate tolerance
A position tolerance commonly creates a diametrical zone for a feature’s derived element relative to basic dimensions and datums. Converting that directly into separate ±X and ±Y values can distort the actual acceptance boundary. For mating patterns, evaluate the functional relationship using the applicable ASME Y14.5 rules and the real assembly geometry.
MMC and bonus tolerance make the available geometry size-dependent
When a feature-of-size control is specified at maximum material condition, the permitted geometric tolerance can increase as actual size departs from MMC. This can improve assembly clearance, but the available bonus varies from part to part. A worst-case functional-boundary analysis and a statistical yield model may therefore answer different questions.
Form and orientation belong only when they move the interface
Flatness, perpendicularity, parallelism, profile, and runout should not automatically be added as separate linear numbers. Include their effect only when the controlled geometry changes the actual functional gap, contact, alignment, or motion in the model—and avoid double-counting variation already bounded by another control.
For the underlying datum, feature control frame, position, and MMC concepts, use the Turn2Engineering GD&T guide.
Standards context: ASME Y14.5-2018 (R2024) remains the current ASME Dimensioning and Tolerancing standard and establishes rules, definitions, symbols, defaults, and practices for stating and interpreting GD&T.
Find the Dominant Contributors Before Tightening Tolerances
Tolerance analysis should guide tolerance allocation. The objective is to create functional margin at the lowest practical manufacturing and inspection burden, not to make every drawing number more precise.
Worst-case contribution
For a linear stack with symmetric tolerances, the absolute worst-case contribution of input i is |ai|ti. Ranking these values immediately shows which contributor consumes the most guaranteed stack margin.
Statistical variance contribution
Under the independent linear RSS model, the variance contribution is proportional to (aiσi)²:
This ranking can differ from worst-case contribution when processes have different capability or when geometric sensitivity coefficients are not ±1.
| Design Lever | When It Is Strong | Benefit | Tradeoff / Check |
|---|---|---|---|
| Increase nominal functional margin | Nominal geometry is unnecessarily close to the requirement. | Improves both worst-case and statistical robustness without demanding tighter manufacturing. | Check packaging, performance, weight, aesthetics, and mating interfaces. |
| Remove a contributor | Assembly architecture creates unnecessary dimensional chains. | Can reduce variation and simplify inspection. | May require redesign of locating or assembly scheme. |
| Change datum strategy | Chain dimensions accumulate location error unnecessarily. | Controls features from a common functional reference. | Must align design, manufacturing, and inspection. |
| Tighten the dominant contributor only | One dimension consumes a large fraction of stack margin. | Targets manufacturing cost where it buys the most functional margin. | Confirm supplier/process capability before tightening. |
| Add adjustment, shimming, or selective assembly | Variation is inherently large but assembly can be measured or adjusted. | Can achieve tight final function without tight individual tolerances. | Adds assembly labor, inventory/control, and possible field error. |
This is also where tolerance analysis connects directly to Design for Manufacturing: the best tolerance scheme meets function while staying realistic for the selected process, supplier, inspection method, and production volume.
When 1D RSS Is Not Enough: Correlation, Nonlinearity, 2D/3D, and Process Shift
Simple linear RSS is powerful because it is simple. It becomes unreliable when contributors are correlated, the assembly response is nonlinear, geometry acts in multiple directions, contact changes, or the production process is not centered and stable.
Correlated dimensions do not combine like independent RSS inputs
Features produced in the same setup, from the same tool offset, from common thermal distortion, or from the same mold can move together. For a linear response, covariance terms appear in the output variance:
Positive correlation can increase output variation when contributors act in the same direction; in other geometries, common-mode motion can cancel. Do not automatically call correlation “bad”—model how it enters the response.
Nonlinear response needs more than first-order RSS
Angular geometry, trigonometric linkages, contact, cam mechanisms, rotating vectors, flexible parts, and clearance-dependent motion can make Y nonlinear. NIST warns that RSS linearization can produce serious error for strongly nonlinear response functions and discusses extended Taylor, numerical integration, and Monte Carlo alternatives.
2D and 3D stacks require vector and datum thinking
Hole patterns, brackets, linkages, castings, molded housings, optics, and complex mechanical assemblies can involve X/Y/Z location and angular variation simultaneously. Reducing these effects to one independent 1D chain can miss the actual mating geometry.
Drawing tolerance is not process capability
A specification tells manufacturing what is acceptable. Capability data describes what the process actually produces. Statistical tolerance analysis should use validated process means, standard deviations, correlations, and stability information when those are available. Cp/Cpk can help characterize capability, but a capability index alone does not supply the full distribution/correlation model needed for a complex Monte Carlo simulation.
Measurement uncertainty consumes decision margin
When the calculated functional margin is similar in magnitude to gauge repeatability, fixture seating, thermal measurement effects, or calibration uncertainty, a nominal analytical pass may not be operationally robust. Coordinate the tolerance model with the actual inspection strategy rather than treating measurement as error-free.
NISTIR 6223 describes statistical tolerancing in terms of assembly-response distributions, explicitly notes mutual dependence is possible, and identifies linear RSS, nonlinear Taylor methods, quadrature, and Monte Carlo as separate analytical approaches.
What to Do When a Tolerance Stack Fails
A failed tolerance stack is a design signal, not an instruction to tighten every dimension. First determine whether the problem is nominal geometry, model definition, datum architecture, one dominant contributor, process capability, or the assembly concept itself.
Then: change geometry first. Manufacturing precision should not be used to rescue an unnecessarily fragile nominal design.
Then: target that feature, process, datum, or tolerance before changing the whole drawing.
Then: evaluate a functional datum scheme or architecture that removes unnecessary accumulation.
Then: investigate process centering, variation, correlation, selective assembly, adjustment, or process improvement with actual production data.
Add effects that are real but not drawing tolerances
Thermal expansion, coatings, wear, gasket compression, press-fit deformation, torque-induced seating, weld distortion, plastic creep, spring load, and structural deflection may change the same functional output. Keep these effects visibly separate from manufacturing tolerances so the model is understandable and ownership is clear.
Perform stack analysis before detailed release
Tolerance analysis is most valuable while geometry and datum strategy can still change cheaply. Once tooling, suppliers, fixtures, inspection programs, and drawings are released, the organization can become locked into expensive precision that a better architecture could have avoided.
Senior Engineer Tolerance Stack Review Checklist
Use this checklist before releasing a stack-driven interface. It is designed to catch physically wrong models, unsupported statistical assumptions, and false margin.
- The functional output is explicit: A measurable minimum, maximum, range, yield, or probability requirement is stated before the stack is built.
- The nominal design is sensible: The functional margin is not being created entirely by unrealistically tight tolerances.
- The physical loop is continuous: Every included dimension connects through real assembled features from reference to output.
- Every coefficient/sign is checked: Increasing each Xi produces the predicted direction and sensitivity in Y.
- No contributor is counted twice: Chain dimensions, derived dimensions, and geometric controls are not redundantly stacked.
- No physical contributor is missing: Coatings, shims, washers, seals, gaskets, seating, inserts, snap rings, deformation, or other real stack elements are included where material.
- Asymmetric limits remain asymmetric: Unilateral tolerances are evaluated using actual limits rather than silently converted to symmetric ± values.
- The datum model matches function: The calculation uses the same locating logic the assembly and inspection process use.
- GD&T is not reduced blindly to ± values: Position, profile, MMC/LMC, datum boundaries, form, orientation, and runout are modeled according to the actual functional geometry.
- The method matches the decision: Worst-case is used when a guaranteed limit is needed; statistical methods are used only when probability/yield is the intended decision.
- RSS inputs are statistical quantities: Standard deviations or an explicitly stated common tolerance-to-sigma assumption are used instead of unexplained drawing limits.
- Independence is justified: Shared setup, tooling, thermal, molding, casting, or measurement effects have been checked for correlation.
- Linearity is justified: A 1D RSS model is not being applied to a strongly nonlinear or direction-coupled assembly without verification.
- Monte Carlo inputs have provenance: Distribution shapes, means, sigmas, truncation, correlations, and process shifts come from evidence or are clearly labeled assumptions.
- Process centering is considered: A statistically capable but off-center process is not modeled as perfectly centered by default.
- Measurement uncertainty is proportionate to margin: Gage/fixture effects are not the same order as the claimed design margin without being addressed.
- Environmental effects are separated and checked: Temperature, load deflection, wear, creep, coating thickness, and assembly force are included when they move the functional result.
- Dominant contributors are ranked: The team knows which dimensions consume worst-case margin or statistical variance.
- Tightening a tolerance has a manufacturing basis: Supplier/process capability and inspection method support any proposed tighter requirement.
- The stack closes with a decision: Pass, redesign, re-datum, change nominal geometry, tighten one feature, improve process, add adjustment, or gather more capability data.
Do not release a critical tolerance stack when the physical loop is disputed, GD&T has been converted to linear variation without a defensible model, RSS uses unsupported distribution assumptions, the pass margin is comparable to unmodeled manufacturing/measurement effects, or the result has no explicit functional acceptance criterion.
After the stack is closed, make sure the resulting drawing communicates the same intent through GD&T and remains economically producible through Design for Manufacturing.
Tolerance Analysis Engineering References
The references below support the statistical-analysis framework, tolerance-modeling concepts, and current ASME GD&T context used on this page. Project requirements, customer standards, supplier capability evidence, and validated analysis methods still control a real design.
- National Institute of Standards and Technology — Design for Tolerance of Electro-Mechanical Assemblies: An Integrated Approach NISTIR 6223 — surveys worst-case, RSS/linear propagation, nonlinear propagation, numerical integration, Monte Carlo simulation, assembly response modeling, statistical dependence, and iterative tolerance synthesis.
- National Institute of Standards and Technology — Information Models for Design Tolerancing NISTIR 6524 — addresses information and representation needs for design tolerancing and assembly tolerance relationships.
- ASME — Y14.5-2018 (R2024), Dimensioning and Tolerancing Current ASME Y14.5 edition/status as of August 2026. ASME states that it establishes symbols, rules, definitions, requirements, defaults, and recommended practices for GD&T and related product-definition requirements.
Frequently Asked Questions
What is tolerance stack up analysis?
Tolerance stack up analysis calculates how dimensional and geometric variation combines across an assembly to affect a functional output such as clearance, interference, endplay, alignment, preload, or fit.
What is the difference between worst-case and RSS tolerance stack up?
Worst-case combines allowable extremes to determine guaranteed limits for the modeled specification. RSS is a statistical propagation method that combines standard deviations for an approximately linear response under independence assumptions. RSS estimates likely variation; it does not guarantee that every permitted dimensional combination will pass.
Can I use drawing tolerances directly in an RSS equation?
Only if you explicitly define how each drawing tolerance maps to statistical spread. The familiar square-root-of-squared-tolerances shortcut assumes the tolerances represent the same statistical coverage multiple and that the contributing variables satisfy the required independence and linearity assumptions.
When should I use Monte Carlo tolerance analysis?
Monte Carlo is useful when the response is nonlinear, inputs have non-normal or truncated distributions, correlation matters, or the geometry is too complex for a simple closed-form RSS model. The simulation still needs credible distributions, correlations, and a validated response model.
How does GD&T affect a tolerance stack?
GD&T changes how feature variation is bounded relative to datums and basic dimensions. Position, profile, MMC/LMC, datum behavior, form, orientation, and runout should be included according to their actual effect on the functional interface rather than converted automatically into independent linear ± dimensions.