Key Takeaways
- Definition: Atterberg Limits describe the water contents where a fine-grained soil changes from solid to semisolid, plastic, and liquid behavior.
- Use case: They help engineers classify cohesive soils, screen workability and swell risk, and compare borrow, subgrade, and foundation materials.
- Main decision: The most important outcome is not a single number, but what the combination of LL, PL, and PI says about behavior in the field.
- Outcome: After this page, you should be able to interpret Atterberg data, understand its limits, and connect it to practical geotechnical decisions.
Table of Contents
Introduction
In brief: Atterberg Limits are index tests that show how fine-grained soil behavior changes with moisture, helping engineers classify soils and judge plasticity, workability, and potential performance problems.
Who it’s for: Students, FE/PE prep, and practicing engineers.
These limits are simple tests, but they influence a surprising number of design and construction decisions because they reveal how sensitive a soil is to water content.
Atterberg Limits infographic
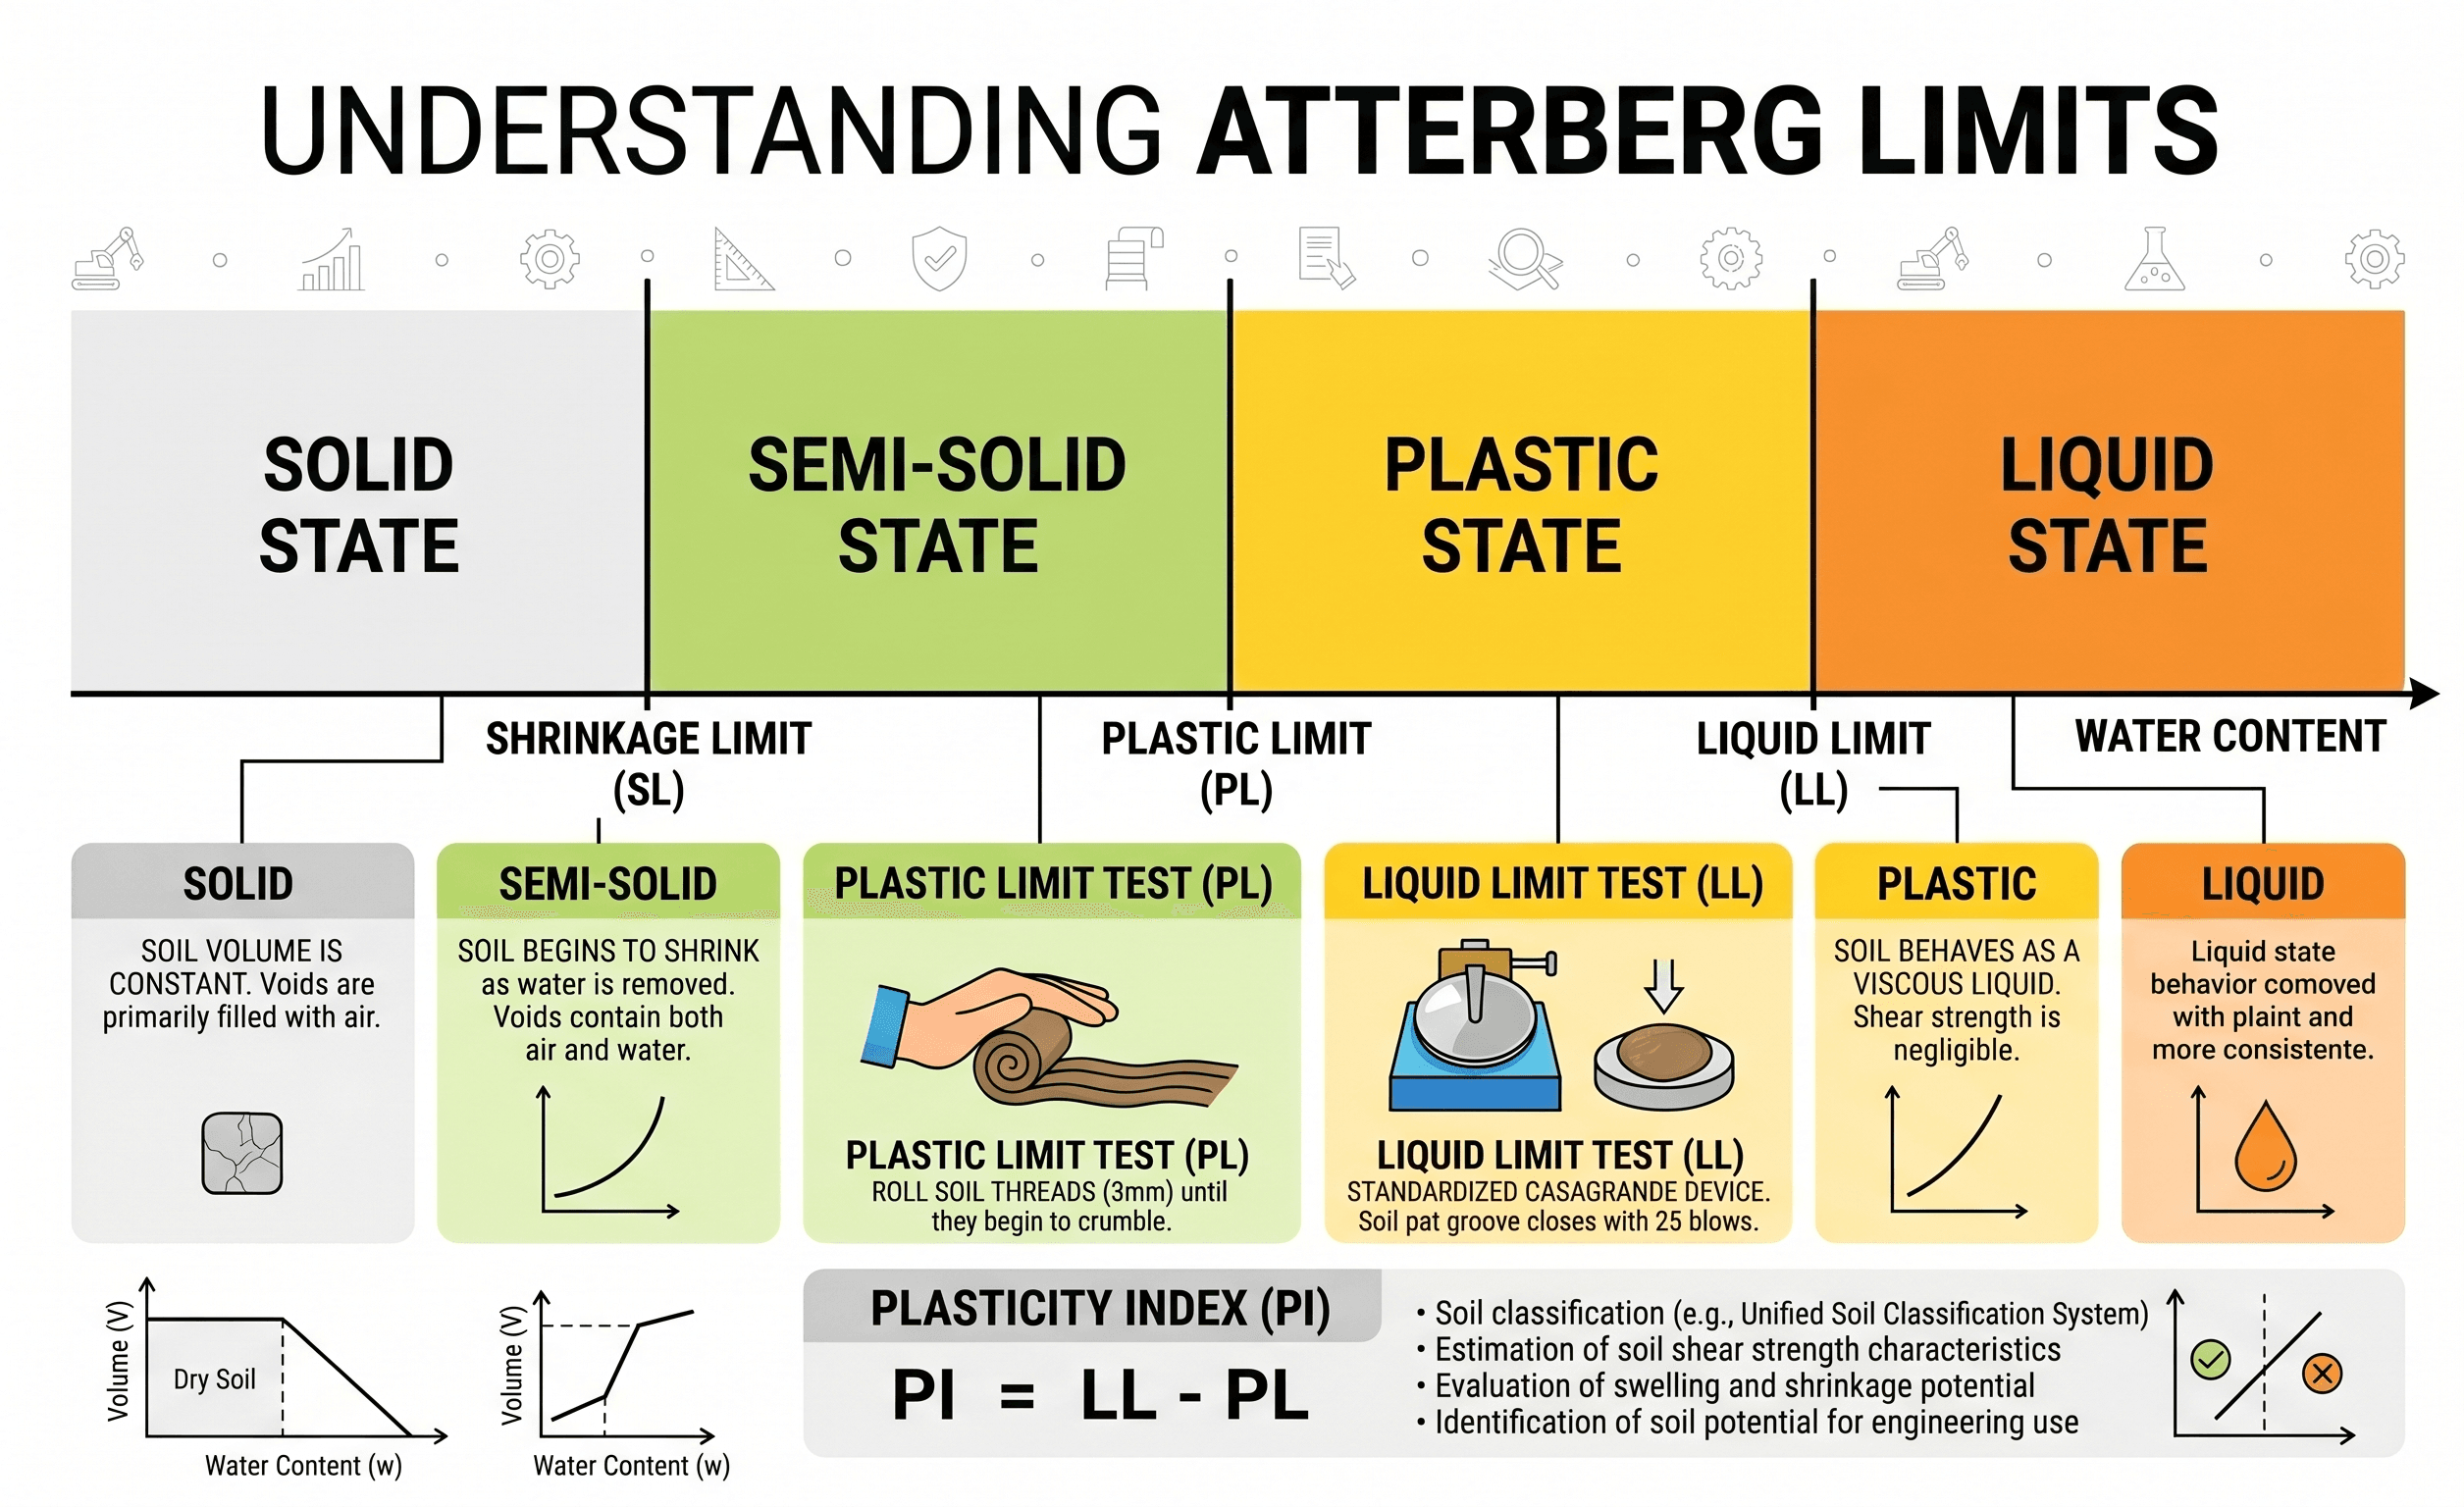
The first thing to notice is that Atterberg Limits are really a behavior map. The gap between the liquid limit and plastic limit defines the plasticity index, which is often the most useful quick indicator of how reactive and moisture-sensitive a clayey soil may be.
What are Atterberg Limits?
Atterberg Limits are laboratory index properties used mainly for fine-grained soils such as silts and clays. They define water contents at which the soil changes from one consistency state to another. In practice, engineers usually focus on the liquid limit (LL), plastic limit (PL), and plasticity index (PI).
These values do not directly tell you ultimate bearing capacity, settlement magnitude, or shear strength under a particular loading condition. What they do provide is a fast, standardized way to compare soils and infer behavior. A higher-plasticity soil tends to be more moisture-sensitive, more deformable, and often more difficult to compact and manage consistently in the field.
This is why Atterberg data appears everywhere in geotechnical work: soil classification, pavement subgrade evaluation, borrow source screening, earthwork specifications, expansive soil screening, and early foundation risk discussions. They are often among the first lab results engineers review because they help frame what other testing will matter most.
Core principles, variables, and units
All Atterberg values are expressed as water content percentages. Conceptually, they answer a simple question: how wet does this fine-grained soil need to be before its mechanical behavior changes in a meaningful way?
Key variables and what they mean
The liquid limit is the water content where the soil begins behaving more like a viscous material than a plastic mass. The plastic limit is the water content where the soil begins to crumble when rolled into threads, marking the lower bound of the plastic range. The plasticity index is the width of that plastic range and is often the easiest value to compare across projects.
- LL Liquid limit, %, the water content at the boundary between plastic and liquid behavior.
- PL Plastic limit, %, the water content at the boundary between semisolid and plastic behavior.
- PI Plasticity index, %, calculated as \( PI = LL – PL \); indicates the width of the plastic range.
- w Natural or measured water content, %, often compared against LL and PL to judge current condition and handling behavior.
From an engineering standpoint, PI is valuable because it compresses two test results into one comparison number. A soil with a low PI may be only weakly plastic or borderline silty. A soil with a high PI tends to stay moldable over a wider moisture range, but that same trait often comes with greater shrink-swell potential, more sensitivity to seasonal moisture changes, and more uncertainty in construction handling.
Typical interpretation ranges
There is no single global threshold that answers every design question, but broad interpretation still helps. Very low PI values often indicate nonplastic or slightly plastic fines. Moderate PI values often suggest lean clays or mixed fine soils. High PI values generally point toward more plastic clays that deserve closer attention for expansive behavior, compaction control, and long-term volume change.
Do not read LL or PI in isolation. The same PI can mean very different things depending on gradation, mineralogy, natural moisture, density, and whether the soil is compacted fill or undisturbed subgrade.
How engineers actually use Atterberg Limits
Engineers rarely run Atterberg Limits just to fill out a lab sheet. The real purpose is to guide decisions. The test helps answer whether a soil is likely to behave more like silt or clay, whether it may be difficult to handle at variable moisture contents, and whether more targeted testing is needed before design or construction.
1) Confirm the soil has enough fines for the test to matter. 2) Review LL, PL, and PI together. 3) Compare results with gradation and classification. 4) Ask what the project needs: compaction control, pavement support, swell screening, or foundation performance. 5) Decide whether index data is enough for screening or whether strength, consolidation, permeability, or swell testing must follow.
On many jobs, Atterberg Limits are part of a first-pass screening workflow. For earthwork, they help judge moisture sensitivity, compaction difficulty, and whether a borrow source is likely to be forgiving or troublesome. For pavements, they help identify subgrades that may soften significantly when wet. For foundations, they flag the possibility of compressible or expansive clay behavior, but they are only the beginning of the evaluation.
Equations and calculations
The main calculation is simple, but the interpretation is where the engineering value lies.
If a soil has a liquid limit of 52% and a plastic limit of 24%, the plasticity index is 28. That number tells you the soil remains plastic over a relatively wide water-content band. In practical terms, it often points toward a clayey material that may be more sensitive to moisture changes than a low-PI silt.
Engineers also compare Atterberg data with classification tools such as the plasticity chart under the Unified Soil Classification System. That chart helps distinguish silts from clays and low-plasticity from high-plasticity fine soils. The chart is useful because two soils with similar percentages of fines can still behave very differently if one is low-plasticity and the other is highly plastic.
A PI cannot be negative if the data is valid. If PL comes out higher than LL, check sample preparation, test execution, data transcription, and whether the material is essentially nonplastic.
Worked example
Example: screening a clayey subgrade
Assume a roadway project encounters a fine-grained subgrade with the following lab results:
- Liquid limit, \(LL = 58\%\)
- Plastic limit, \(PL = 27\%\)
- Natural water content, \(w = 31\%\)
First compute the plasticity index:
A PI of 31 is high enough to immediately raise questions about moisture sensitivity and volume-change potential. The natural water content being just above the plastic limit suggests the soil in the field may already be in a soft, moldable state rather than a friable one. That matters for grading operations, proof rolling, and construction trafficability.
At this point, a good engineer does not say, “The soil is bad,” and stop there. Instead, the engineer asks what this result means for the project. For pavement support, the next questions may involve strength loss when wet, resilient response, drainage, and whether stabilization is warranted. For foundations, the next questions may involve seasonal moisture variation, heave risk, compressibility, and whether the upper active zone needs treatment or replacement.
The real value of the example is the workflow: Atterberg Limits do not finish the design, but they tell you what kinds of problems are likely and where to spend testing and mitigation effort next.
Engineering judgment and field reality
This is where many new engineers overtrust the test. Atterberg Limits are run on a processed laboratory sample, not on the full in-place field condition with structure, fabric, fissures, roots, gravel, desiccation cracks, and seasonal groundwater effects. The numbers are valuable, but the field can still behave differently.
A borrow soil with a moderate PI may compact beautifully under one moisture window and become a productivity problem two rain events later. A natural clay with a high PI may appear acceptable during a dry site visit but later cause slab movement after landscape irrigation or leaking utilities alter the moisture regime. Similarly, two clays with similar PI values can perform differently if one is dominated by more expansive clay minerals.
Experienced engineers use Atterberg data as part of a broader evidence set: classification, moisture-density relationships, geologic setting, depth of active zone, drainage conditions, prior site distress, and construction tolerances. This is especially important on projects involving shallow foundations, pavement subgrades, retaining structures, and cut/fill transitions.
The most expensive mistake is often not “getting the PI wrong.” It is assuming the PI alone captures swell, softening, or constructability when the site moisture regime and soil fabric are really controlling performance.
When this breaks down
Atterberg Limits break down as a decision tool when people expect them to predict more than they can. They do not directly measure compressibility under load, undrained shear strength, long-term drained strength, permeability, collapse, or swell pressure. They are index properties, not full performance tests.
They are also less informative for soils dominated by coarse particles, because the behavior of sands and gravels is controlled more by gradation, density, drainage, and confinement than by plasticity. Even within fine-grained soils, unusual organics, cementation, or highly variable mineralogy can weaken the usual correlations engineers rely on.
Another limitation is scale. A single Atterberg test result can describe a jar sample, but not necessarily the variability across an entire site. If the subsurface changes rapidly laterally or with depth, one PI value may be dangerously misleading when used as a stand-in for the full ground model.
Common pitfalls and engineering checks
- Assuming PI alone can determine whether shallow foundations are acceptable.
- Using classification-level data as a substitute for swell, consolidation, or shear testing.
- Ignoring natural moisture content and seasonal moisture variation when interpreting LL and PL.
- Applying fine-grained soil rules to soils with too little plastic fines for the index to control behavior.
- Comparing Atterberg results from different samples without checking whether the materials are actually comparable in gradation and origin.
A high PI should trigger better questions, not an automatic rejection. The right response may be drainage improvement, moisture control, stabilization, overexcavation, or simply more targeted testing, depending on project risk and performance criteria.
| Item to check | Why it matters | Good engineering question | Typical next step |
|---|---|---|---|
| High liquid limit | Often points to greater compressibility and moisture sensitivity | Will this soil soften or deform too much when wet? | Review compaction, strength, and settlement implications |
| High plasticity index | Suggests wider plastic range and potentially greater volume-change risk | Is expansive behavior or difficult handling likely? | Consider swell screening and moisture-management strategy |
| Natural water near or above PL | May indicate soft field handling conditions | Can the soil be worked efficiently under current site moisture? | Check trafficability and compaction plan |
| Low or near-zero PI | May indicate siltier behavior or nonplastic fines | Will the soil be more brittle, erodible, or frost-sensitive? | Pair with gradation and drainage review |
How to visualize Atterberg Limits in practice
A useful mental picture is to imagine slowly adding water to a dry clay. At first the soil is stiff and crumbly. Add enough moisture and it becomes moldable without breaking apart. Add still more and it loses shape and starts flowing under small disturbances. Atterberg Limits mark those transitions.
That visualization matters because it connects the lab result to construction reality. A soil compacted near one threshold may handle very differently from the same soil after rainfall or wet utility trench backfill. Engineers are not just classifying the soil; they are anticipating how it will behave when touched by equipment, water, and time.
Relevant standards and design references
These are the references most commonly tied to Atterberg Limits and their practical use in geotechnical work.
- ASTM D4318: The core laboratory standard for liquid limit, plastic limit, and plasticity index of soils. This is the primary source for how the tests are performed and reported.
- AASHTO soil classification procedures: Commonly used in transportation projects to connect index properties and gradation to subgrade-oriented classification decisions.
- USCS classification practice: Used to interpret LL and PI with gradation and the plasticity chart so soils can be grouped consistently for engineering communication.
- Project specifications for earthwork and pavement subgrade: Often set acceptance limits or screening thresholds based on PI and related index data.
A strong practice point is to separate test standard from design criteria. ASTM D4318 tells you how to measure the property. It does not tell you what PI is acceptable for your embankment, slab-on-grade, or pavement section. That acceptance decision comes from project performance requirements, experience, and governing specifications.
Frequently asked questions
Atterberg Limits are measured index properties, while soil classification is the broader system that uses those properties together with gradation and other observations to place the soil into a group. In other words, the limits are inputs; the classification is the interpreted label.
The plasticity index tells you how wide the workable plastic range is, which often gives a faster feel for moisture sensitivity and clay-like behavior. Liquid limit is still important, but PI is usually the more intuitive comparison number when screening multiple soils.
Not by themselves. High plasticity often raises concern, but true expansive-soil evaluation should also consider mineralogy, suction and moisture variation, depth of active zone, site drainage, and when necessary, dedicated swell or heave testing.
Usually only to the extent that plastic fines are present. For clean sands and gravels, density, gradation, drainage, and confinement are typically much more important than plasticity measures.
The next step depends on project risk, but common follow-ups include gradation, moisture-density relationships, strength testing, consolidation or swell testing, and a site-specific review of drainage and seasonal moisture exposure.
Summary and next steps
Atterberg Limits are one of the simplest and most useful index tools in geotechnical engineering because they turn moisture-sensitive soil behavior into comparable numbers. Liquid limit, plastic limit, and plasticity index help engineers communicate what kind of fine-grained soil they are dealing with and what kinds of performance concerns may follow.
The biggest practical lesson is that the values are screening tools, not final design answers. Good engineering judgment comes from combining Atterberg data with gradation, field moisture conditions, compaction behavior, drainage, and the actual performance demands of the project. Used that way, the test becomes far more valuable than a classification formality.
On real projects, the best use of Atterberg Limits is often to narrow uncertainty early. They help you decide whether the soil deserves more testing, whether moisture control will likely govern construction quality, and whether the foundation, earthwork, or pavement conversation needs to shift toward risk mitigation instead of assumption-based optimism.
Where to go next
Continue your geotechnical learning path with these related topics.
-
Read Soil Mechanics
Build the broader framework for understanding water content, effective stress, classification, and how fine-grained soils behave.
-
Study the Standard Proctor Test
See how plasticity connects directly to moisture-density behavior and compaction decisions in earthwork and pavement projects.
-
Explore Expansive Soils
Go deeper into the movement and distress risks that can arise when highly plastic clayey soils undergo moisture change.