Key Takeaways
- Definition: Public transportation is the shared movement of people using scheduled, fixed-route or demand-responsive services that are planned and operated at the corridor or network level, rather than vehicle by vehicle.
- Application: Transportation engineers design routes, frequency, stops, lanes, and stations so buses and trains can carry high passenger volumes with acceptable travel times, comfort, safety, and accessibility.
- Outcome: After this guide, you’ll understand the main modes, design variables, performance metrics, and a simple workflow for sizing and evaluating public transportation services.
- Context: Public transportation sits alongside traffic flow theory, transportation planning, and transportation modeling in the broader Transportation Engineering toolkit.
Table of Contents
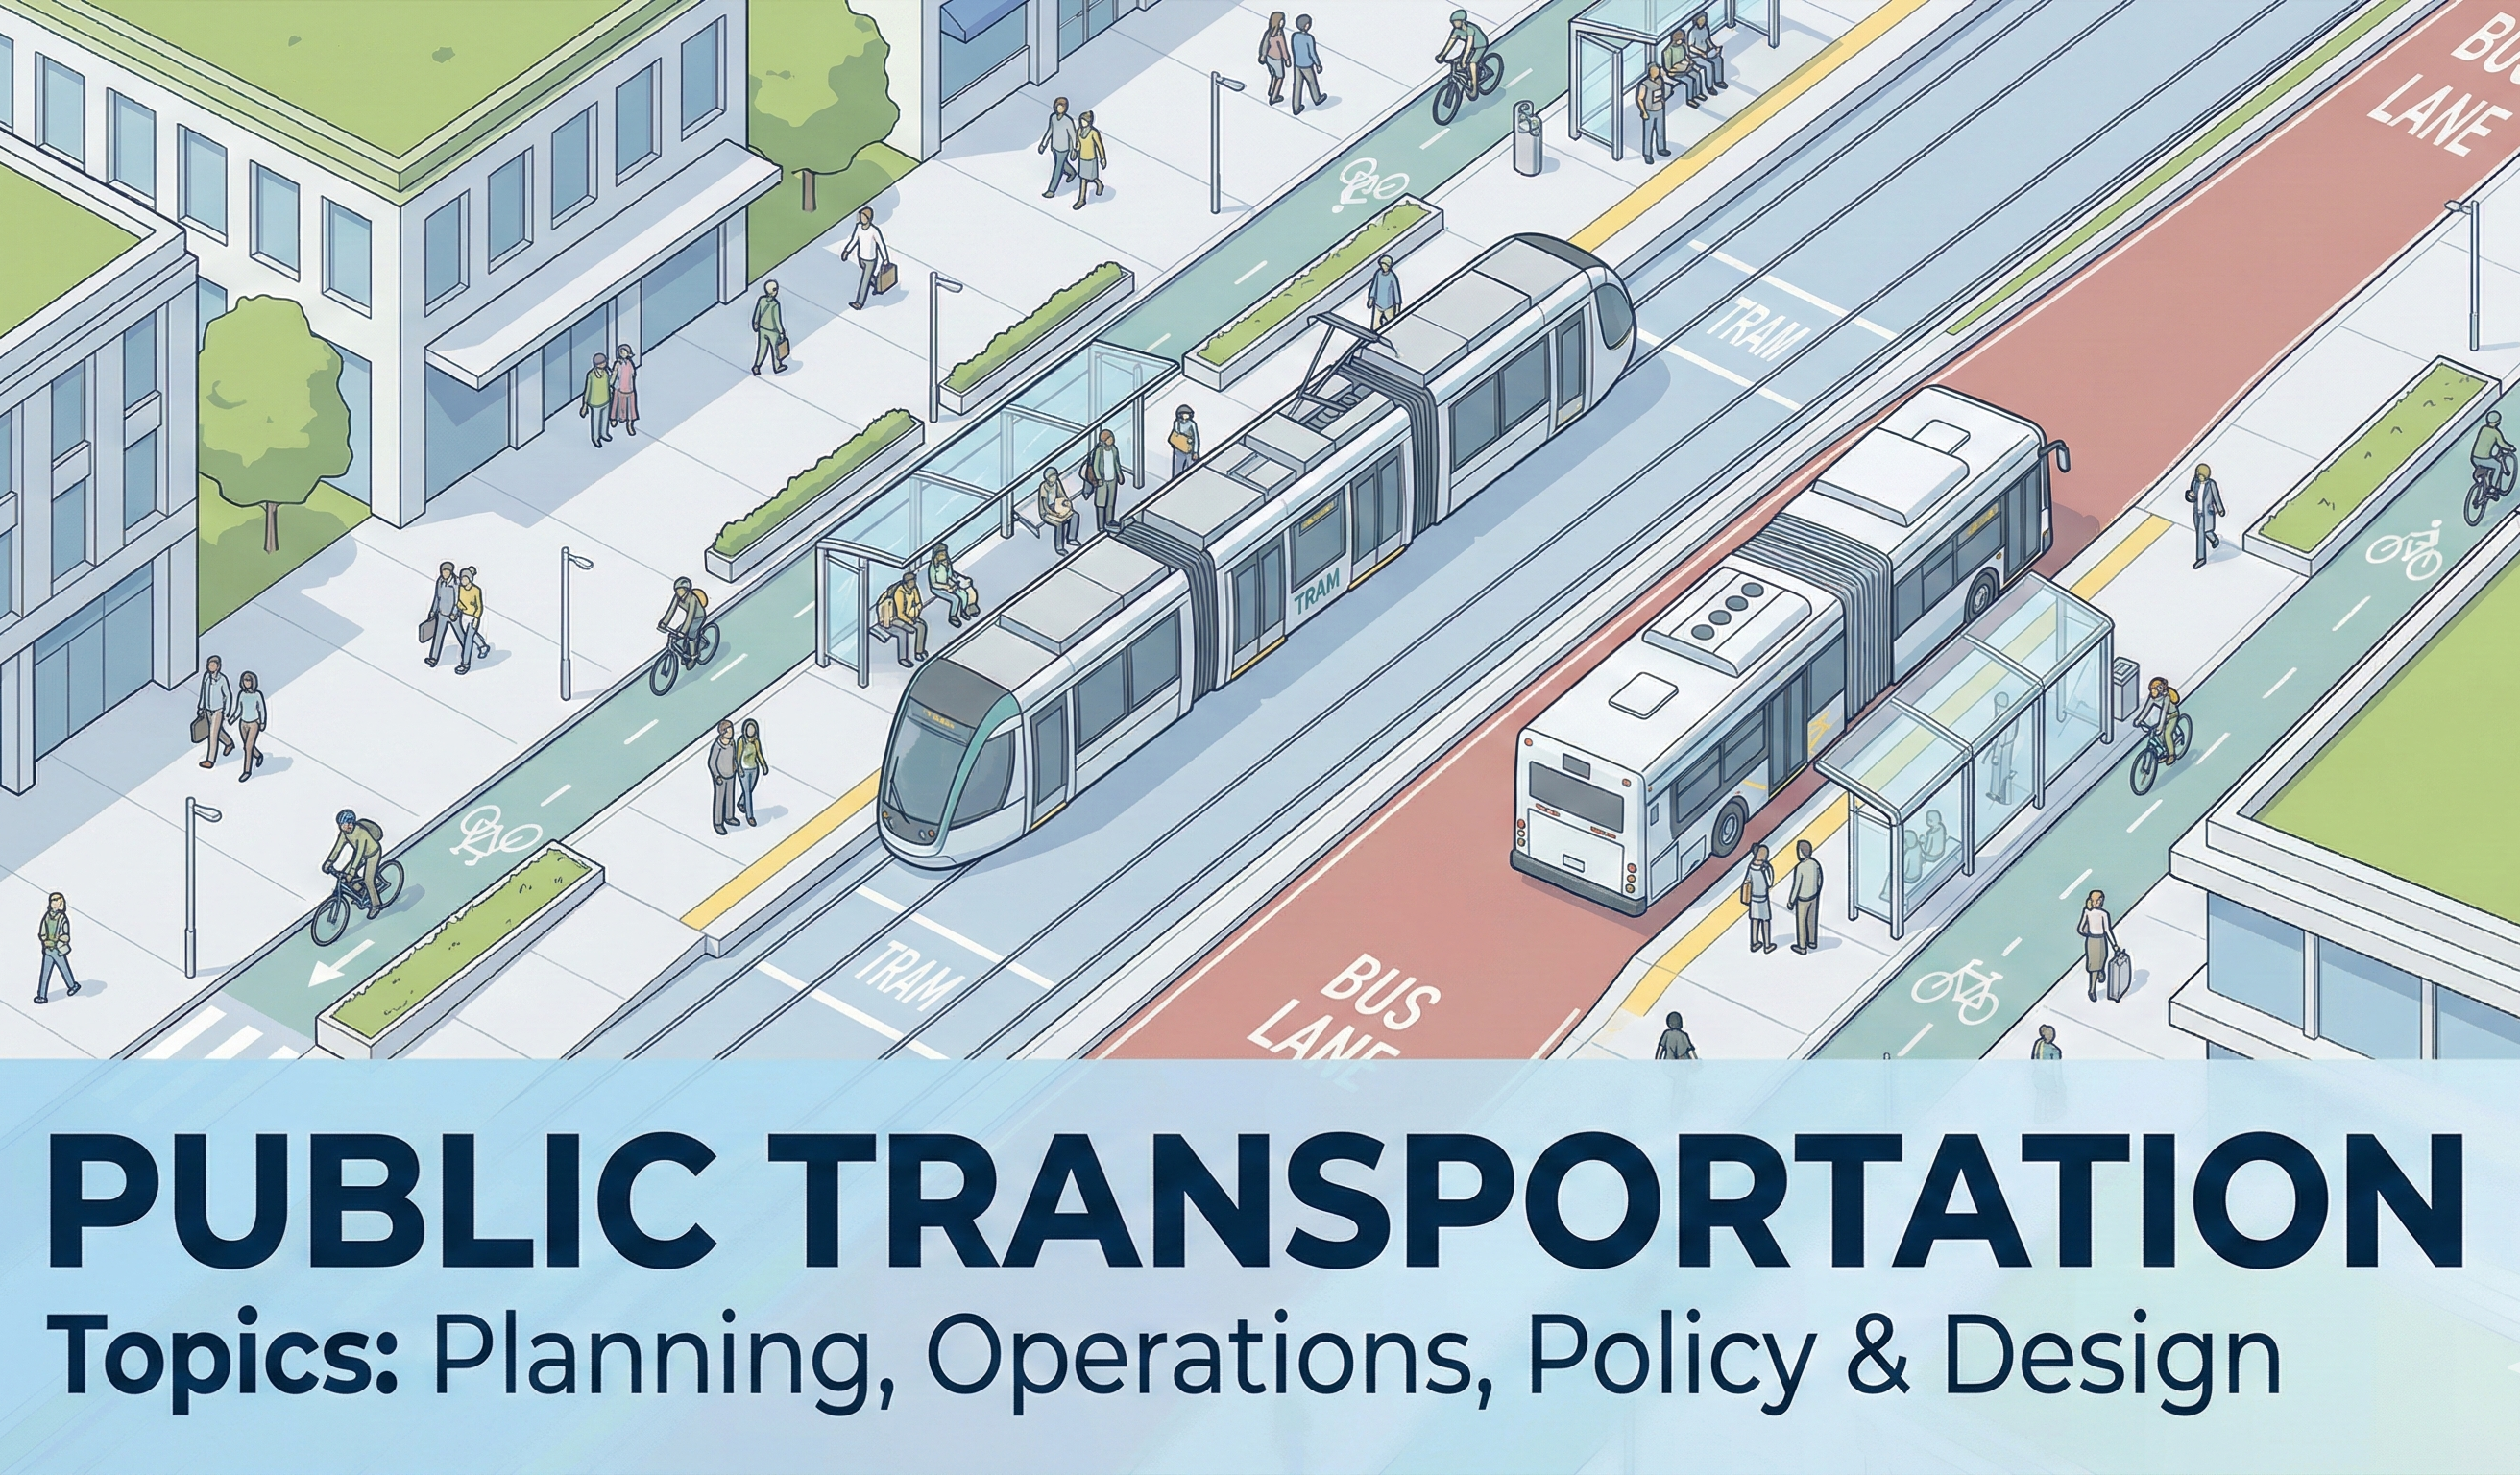
Featured diagram
Introduction
Public transportation is one of the most powerful levers transportation engineers have for moving large numbers of people with limited space, energy, and budget. Instead of sizing every road around the private automobile, we can design networks of buses, trains, and flexible services that share vehicles and infrastructure across thousands of daily trips.
For engineering students, public transportation links theory with real-world trade-offs: capacity versus cost, speed versus access, and frequency versus coverage. For working engineers and planners, it is where geometric design, traffic operations, modeling, and policy all collide.
This guide focuses on public transportation from an engineering perspective. You’ll see how modes differ, which design variables actually matter, how to interpret common performance metrics, and how a simple service planning workflow turns demand estimates into routes and frequencies. A short numeric example shows how to size a bus route, and references at the end point you toward standards and deeper transit design resources.
What is public transportation in transportation engineering?
In transportation engineering, public transportation is the set of shared mobility services—such as buses, rail transit, and demand-responsive shuttles—planned, designed, and operated to move many people efficiently along corridors and networks using common vehicles, stops, fares, and schedules instead of individual cars.
The key word for engineers is shared. We are not optimizing one driver’s trip; we are optimizing thousands of trips that overlap in space and time. That is why public transportation is typically designed at the corridor or network scale: we choose alignments, stop locations, and frequencies that work reasonably well for many users, then refine details like signal priority, stop amenities, and fare collection.
Public transportation also spans a spectrum of service models:
- Fixed-route, fixed-schedule: Buses or rail vehicles follow a set path and timetable.
- Flexible-route / demand-responsive: Smaller vehicles serve zones based on trip requests.
- High-capacity corridors: Bus rapid transit (BRT) and rail lines designed for very high passenger throughput.
Across all of these, transportation engineers must balance mobility, safety, comfort, cost, and long-term land use objectives. Understanding public transportation is therefore fundamental before tackling more advanced topics like transportation planning or transportation modeling.
Major public transportation modes and service patterns
Public transportation is not a single technology. Each mode has its own capacity, speed, cost, and right-of-way requirements. Engineers often compare modes using passenger capacity per hour, typical operating speeds, and infrastructure complexity.
Core transit modes
- Local bus: Frequent stops (200–400 m spacing), moderate speeds, flexible routing, relatively low infrastructure cost. Ideal for coverage and access.
- Bus rapid transit (BRT): Bus service in dedicated lanes with higher speeds, fewer stops, off-board fare collection, and enhanced stations. Designed to provide rail-like performance with lower capital cost.
- Light rail and tram: Electric rail vehicles operating in mixed traffic or dedicated lanes, good for medium to high demand corridors with strong land-use coordination.
- Heavy rail / metro / subway: Grade-separated rail with very high capacity and speed, used where demand justifies major capital investment.
- Commuter rail and regional rail: Longer-distance services linking suburbs or regional centers to a central city, with fewer stops and higher speeds.
- Demand-responsive transit and paratransit: Flexible, often small-vehicle services triggered by trip requests, critical for low-density areas and users requiring door-to-door accessibility.
Service patterns engineers work with
For each mode, engineers design service patterns that describe how vehicles move through the network:
- Radial vs. grid networks: Radial lines converge on a central business district; grid networks support many-to-many trips with transfers.
- Express vs. local services: Express routes skip many stops to provide faster trips over longer distances, often layered on top of local routes.
- Trunk-and-feeder: Local routes feed high-capacity trunk lines (e.g., bus to rail station).
- Peak vs. off-peak patterns: More frequency and sometimes shorter routes during peak hours, with simplified networks at other times.
Choosing modes and service patterns is where engineering, operations, and policy meet. The “best” design depends not only on demand but also on funding, right-of-way, political priorities, and the long-term vision for the urban form.
Why public transportation matters for cities and regions
Public transportation plays a unique role in the transportation system because it can carry far more people in the same amount of space than private cars. A full bus in a dedicated lane can move the equivalent of several lanes of traffic, while a metro line can match or exceed a freeway’s person-throughput with a much smaller footprint.
Capacity, efficiency, and reliability
From an engineering perspective, public transportation allows us to:
- Increase corridor capacity (people per hour) without endlessly widening roads.
- Improve reliability by using dedicated lanes, signal priority, and grade separation to shield transit from congestion.
- Optimize fleets by matching vehicle sizes and frequencies to demand throughout the day.
Sustainability and equity
Well-designed public transportation reduces per-capita emissions, lowers the energy required per trip, and supports compact, walkable development. It also provides affordable mobility for people who cannot or choose not to drive—students, seniors, people with disabilities, and households without cars.
Equity-focused transit design considers:
- Access to jobs and services: How many opportunities can riders reach within a given travel time?
- Fare structure: Are fares affordable and predictable for low-income riders?
- Accessibility: Are vehicles, stops, and stations usable by people with mobility, vision, or hearing impairments?
When evaluating a transit corridor, a senior engineer will always ask: “If we reallocated one lane of car traffic to high-quality transit, what would happen to person throughput, travel time reliability, safety, and emissions over the corridor’s life span?”
Key design variables and performance metrics
While public transportation involves many qualitative decisions, several core variables and metrics show up on nearly every project. Understanding them helps you sanity-check designs and compare alternatives.
Design variables engineers control
- Headway (H): Time between vehicles on a line (seconds or minutes).
- Vehicle capacity (S): Number of passengers a vehicle can safely carry (seated plus standing).
- Load factor (LF): Ratio of actual passengers to design capacity (often 0.7–1.2 depending on comfort targets).
- Operating speed (vop): Average in-service speed including stops and delays.
- Stop spacing: Distance between stops or stations, which trades access against speed.
This simple relationship estimates the theoretical passenger capacity per hour per direction (C) along a line, assuming evenly spaced vehicles, constant capacity, and a chosen load factor. It is a baseline capacity check; detailed design also considers dwell times, intersections, and terminal constraints.
- C Passenger capacity per hour per direction (passengers/hour). Used to compare corridor designs and modes.
- H Headway between vehicles (seconds). For example, 10 min headways correspond to 600 s.
- S Design passenger capacity per vehicle (passengers). Includes seated and standing passengers based on comfort and safety criteria.
- LF Load factor (dimensionless). A value of 1.0 means the vehicle is at its design capacity; less than 1.0 is more comfortable, greater than 1.0 implies crowding.
Operational performance metrics
In addition to capacity, agencies track:
- Ridership: Boardings per route, per stop, or per system.
- On-time performance: Percentage of trips arriving within a defined time window (e.g., ±3 min).
- Travel time and reliability: Average in-vehicle time and variability across trips.
- Passengers per vehicle-hour or per vehicle-kilometer: Productivity of the service.
- Cost per passenger-trip: Operating cost divided by total passenger trips.
When you sketch a new route, estimate the peak-hour demand and quickly compare it against the corridor’s theoretical capacity using the capacity equation above. If your demand is close to or exceeds capacity, you likely need shorter headways, larger vehicles, or a higher-capacity mode.
Worked example: sizing a simple bus route
This example shows how an engineer might sanity-check the capacity of a bus route serving a busy corridor during the peak hour.
Example
Suppose a corridor is expected to carry 350 passengers per hour per direction in the peak hour. The agency plans to use 12 m buses with a design capacity of S = 80 passengers per bus (seated and standing), and is comfortable with a peak load factor of LF = 0.9. What headway is required?
Step 1 – Rearrange the capacity equation.
Starting from \( C = \frac{3600}{H} \times S \times LF \), solve for headway \(H\):
\[ H = \frac{3600 \times S \times LF}{C} \]
Step 2 – Plug in the numbers.
\[ H = \frac{3600 \times 80 \times 0.9}{350} \]
First compute the numerator: \(3600 \times 80 = 288{,}000\), and \(288{,}000 \times 0.9 = 259{,}200\).
Then divide by the corridor demand: \[ H = \frac{259{,}200}{350} \approx 740 \text{ s} \]
Step 3 – Interpret the result.
A headway of 740 s is about 12.3 minutes. Rounding down slightly to a 12 minute headway provides a bit of spare capacity. If the agency wants a simpler schedule and more comfort, it might choose a 10 minute headway, which would further increase capacity and reduce waiting time.
In practice, you would cross-check this against fleet availability, operating budgets, and signal timings. For more advanced scenarios, you could pair this back-of-the-envelope method with corridor-specific modeling or with dedicated tools in the Turn2Engineering calculators hub.
Design workflow for a public transportation corridor
Every agency has its own process, but most public transportation corridor designs follow a similar workflow. The engineering tasks fit into a broader planning context that includes community engagement, policy decisions, and funding.
Step-by-step workflow
- Define goals and constraints. Clarify whether the project is focused on capacity relief, coverage, equity, speed, or a combination. Identify budget, right-of-way limits, and political constraints.
- Estimate demand. Use observed ridership, surveys, land use data, or transportation modeling outputs to estimate current and future passenger flows along the corridor.
- Select mode and service pattern. Compare buses, BRT, light rail, and other modes using capacity, cost, and operational flexibility. Sketch candidate route alignments and service patterns (local, express, or mixed).
- Set frequency and span of service. Use demand, capacity checks, and policy guidelines (e.g., minimum 10–15 minute headways in the peak) to choose service levels by time of day and day of week.
- Design stops, stations, and priority treatments. Place stops to balance speed and access, design platforms and shelters, and consider transit signal priority, queue jumps, or dedicated lanes where feasible.
- Evaluate performance and iterate. Check travel times, loads, and reliability using both analytical methods and simulation. Adjust stopping patterns, headways, or alignments to meet design targets.
Before a design advances, a senior engineer will ask for a one-page summary that shows: projected ridership, peak load points, capacity versus demand, travel times compared with driving, and any safety or accessibility improvements the project delivers.
Common pitfalls and engineering checks in public transportation design
Many underperforming transit projects suffer from similar design pitfalls. Being aware of them early can save years of disappointing ridership and difficult operations.
- Ignoring all-day demand: Designing only for the peak hour and neglecting midday, evening, and weekend patterns that matter for non-commute trips.
- Overly indirect routing: Routing buses to “touch everything” instead of providing direct, frequent service along strong corridors with good transfers.
- Insufficient frequency: Providing reliable but infrequent service; long headways make transfers painful and discourage ridership even if vehicles rarely crowd.
- Poor stop placement and pedestrian access: Stops that are hard or unsafe to reach undermine the usefulness of otherwise good routes.
- Underestimating dwell time: Not accounting for boarding, alighting, and fare payment time can lead to unrealistic schedules.
A classic mistake is to “solve” crowding by switching to larger vehicles but leaving headways long and stop locations inconvenient. In many cases, riders value shorter waits and simpler routes more than extra seats on an infrequent, circuitous service.
| Design issue | Typical symptom | Engineering check | Potential fix |
|---|---|---|---|
| Low ridership on a main corridor | Half-empty buses, long waits | Compare travel time and frequency to driving and competing routes | Increase frequency, simplify route, add transit priority |
| Overcrowded peak trips | High load factors on select trips | Plot loads by trip and stop to find peaks | Add short-turn trips or reduce headway in the critical segment |
| Unsafe conditions at stops | Mid-block crossings, no lighting | Audit pedestrian access and crash history | Relocate stops, add crossings, lighting, and accessibility upgrades |
Work with real numbers
Engineering calculators & equation hub
Jump from theory to practice with interactive calculators and equation summaries covering civil, mechanical, electrical, and transportation topics.
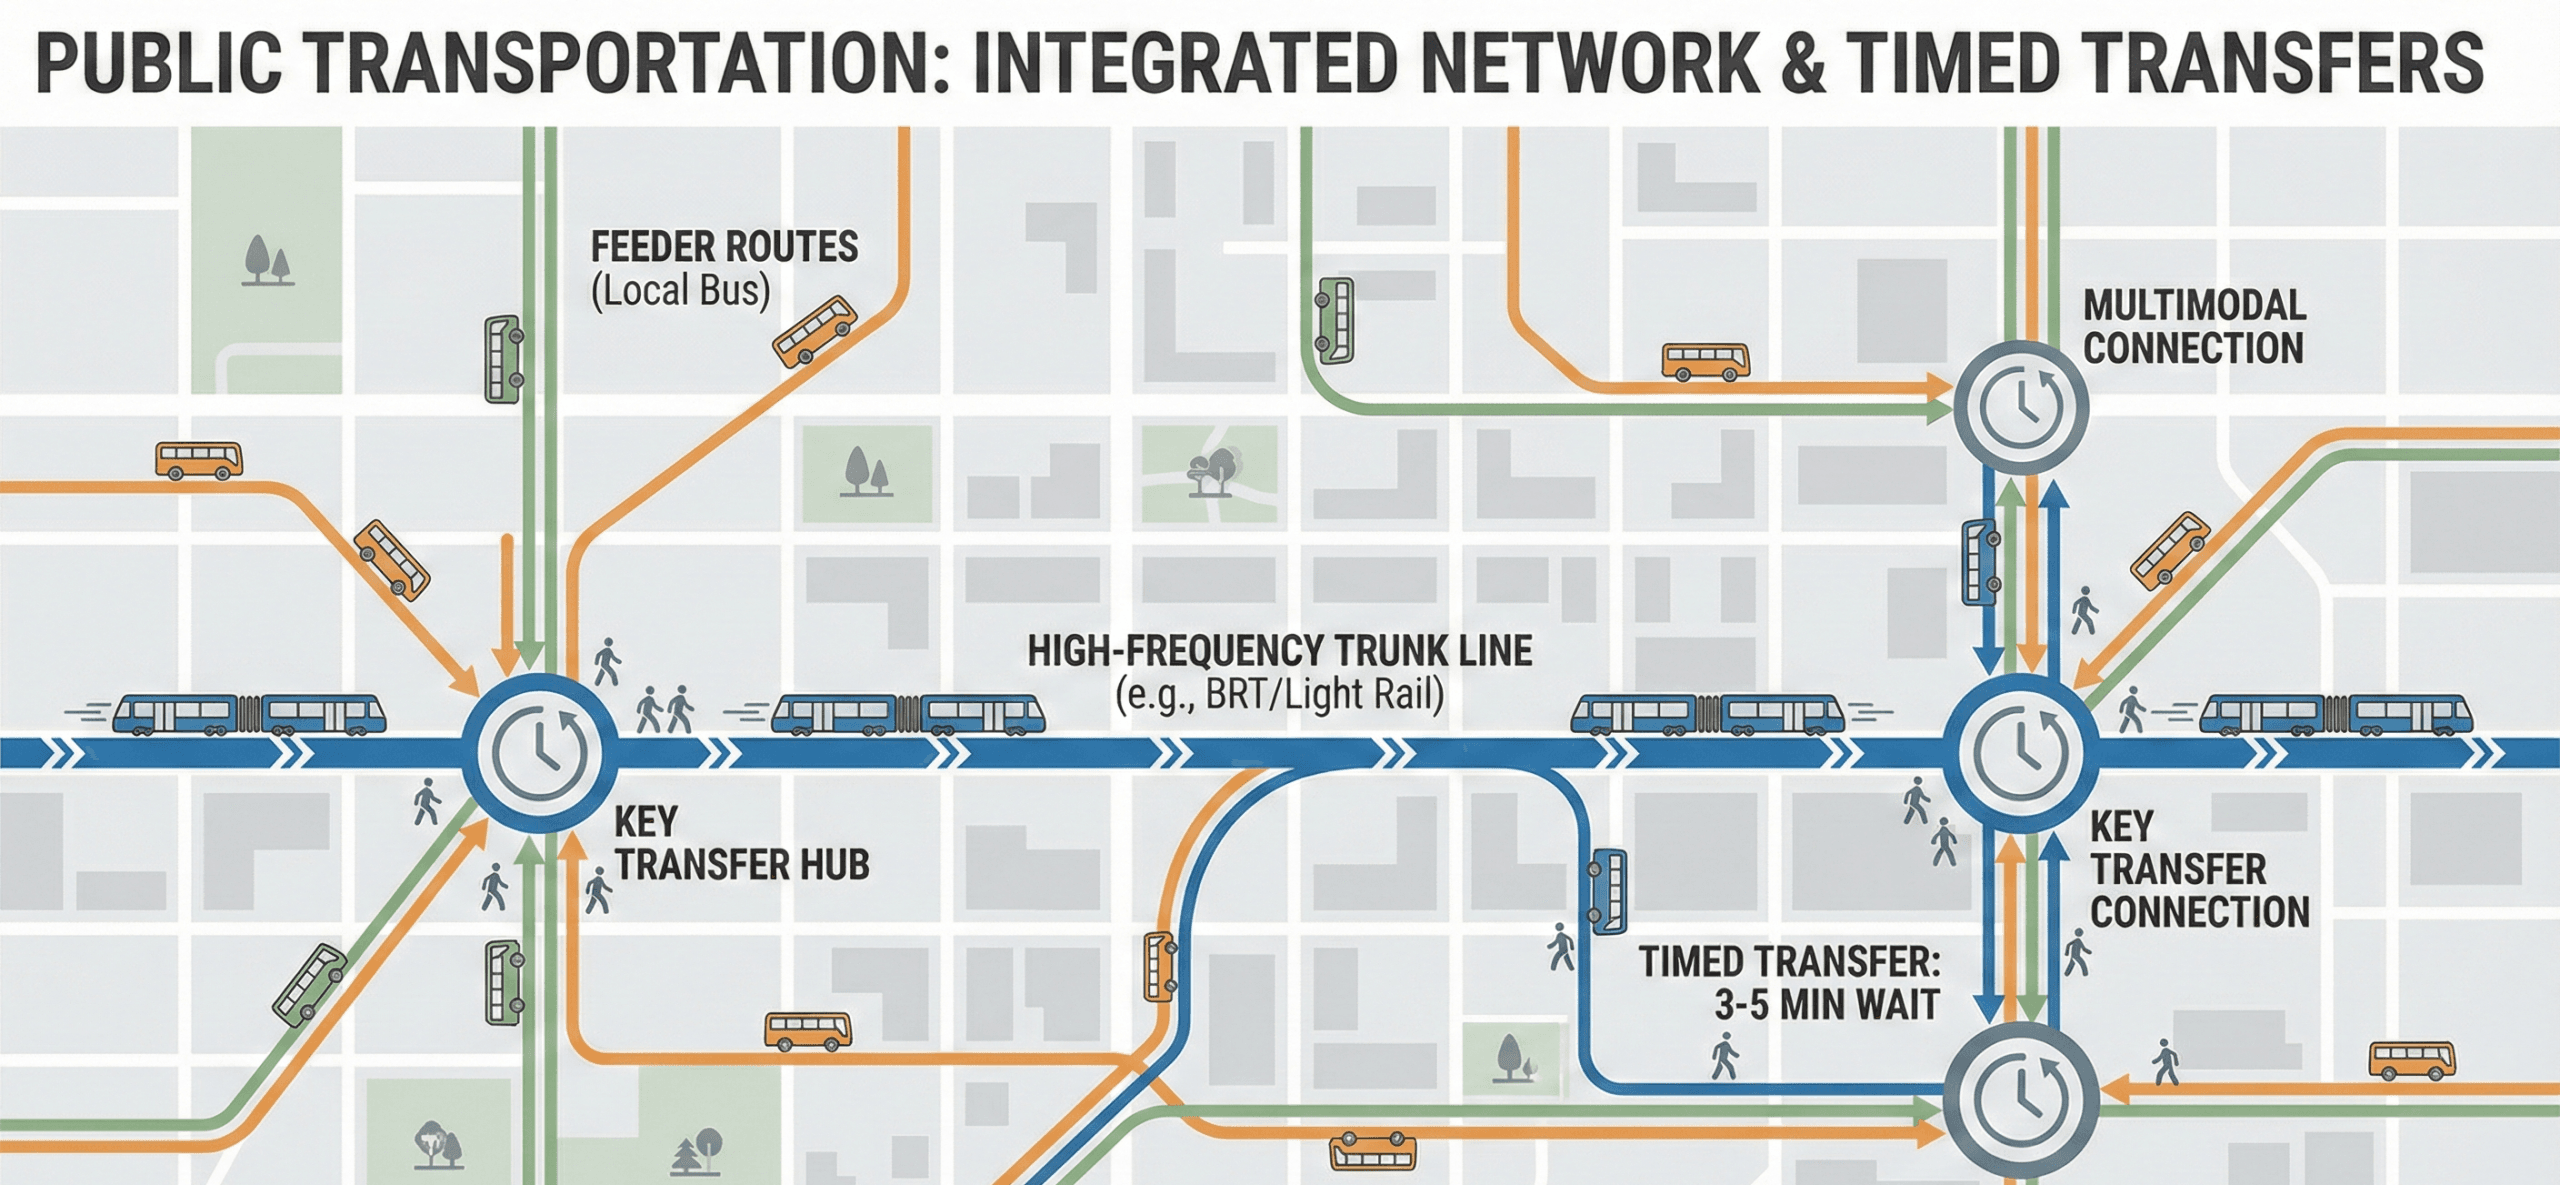
Visualizing a public transportation network
Seeing the network structure helps explain why some riders have direct trips while others must transfer. A simple diagram can highlight trunk routes, feeder services, and how service frequency supports reliable connections.
Key references and standards for public transportation
Transit design draws on a mix of manuals, standards, and agency guidelines. Exact references vary by country, but several themes are common.
- Transit capacity and quality manuals: Documents that define capacity calculations, level of service concepts, and methodologies for evaluating public transportation performance along corridors and at stops or stations.
- Traffic control and signing standards: Manuals that govern bus stop signs, lane markings, signals, and priority treatments where transit interacts with general traffic.
- Accessibility guidelines: Requirements for ramps, lifts, tactile paving, clear floor areas, and information displays to ensure people with disabilities can use vehicles, stops, and stations.
- Local and regional transit design guidelines: Agency-specific documents that set standards for stop spacing, shelter design, passenger information, and minimum service levels by route type.
As a student or early-career engineer, you should get comfortable reading tables, diagrams, and examples from these sources. They provide the formal backing for many of the rules of thumb discussed in this guide.
Frequently asked questions
Public transportation refers to shared mobility services—buses, rail, and demand-responsive transit—planned, designed, and operated to move many people efficiently. Engineers focus on routes, frequency, stops, and infrastructure so these services provide reliable, safe, and accessible travel options at the corridor and network scale.
Public transportation increases person-throughput, reduces congestion and emissions, supports walkable land use patterns, and provides affordable mobility for people who cannot or choose not to drive. Well-designed transit networks are essential for resilient, equitable, and sustainable cities and regions.
Engineers track ridership, passengers per hour, on-time performance, load factors, travel times, and customer satisfaction. They compare these metrics against design targets and peer systems to decide where to add service, adjust routes, or invest in infrastructure upgrades like transit lanes or better stations.
Public transportation relies on shared vehicles, common routes, and published schedules managed by agencies, while private transportation is based on individually owned vehicles and flexible routing. Public transportation uses space and energy more efficiently and can be shaped by policy, but requires careful planning and operations to be attractive.
Summary and next steps
Public transportation is more than a list of modes; it is a system that transportation engineers design to move large numbers of people efficiently and equitably. By understanding headways, capacity, load factors, and service patterns, you can start to see why some routes work well while others struggle.
In practice, transit design lives at the intersection of engineering, operations, and policy. Technical tools help you size fleets, set frequencies, and design stops, but success also depends on land use, funding, and community support. The worked example and capacity checks in this guide are starting points, not replacements for detailed analysis.
As you deepen your skills, aim to connect corridor-level design with network-wide thinking. Strong public transportation systems provide simple, frequent, and legible services that fit into people’s daily lives and support safer, more sustainable cities.
Where to go next
Continue your learning path with these curated next steps.
-
Explore transportation planning
Learn how planners and engineers set goals, analyze demand, and choose between investment options across a full transportation system.
-
Study traffic flow theory
See how vehicle flow, speed, and density relationships shape roadway performance and interact with transit priority treatments.
-
Practice with engineering calculators on Turn2Engineering
Apply equations from this guide and related topics using interactive calculators that help you check units, magnitudes, and design assumptions.
Work with real numbers
Engineering calculators & equation hub
Jump from theory to practice with interactive calculators and equation summaries covering civil, mechanical, electrical, and transportation topics.