
Direct Answer
Stress analysis is the engineering process of determining how loads and constraints create internal stress, strain, deformation, and failure risk in a component or assembly.
A reliable analysis begins with the real load path and boundary conditions, selects equations or FEA that match the geometry and behavior, and compares the resulting stress or deformation to the correct failure criterion. Yielding, fatigue, brittle fracture, buckling, contact damage, creep, and excessive deflection are different design checks—not interchangeable interpretations of one peak stress value.
Mechanical Stress Analysis Process
Stress analysis should answer a design question, not merely produce a contour plot. The analysis needs a defined load case, a defensible model of how the part is supported, and an acceptance criterion tied to the failure mode that matters.
Geometry, material condition, interfaces, supports, load cases, temperature, duty cycle, and required life or performance.
Internal loads, stress, strain, deflection, local concentrations, contact, fatigue demand, and stability as required.
Units, equilibrium, load path, assumptions, mesh behavior, material allowables, safety margin, and physical plausibility.
-
Define the design question.
State what must be shown: no yielding, acceptable deflection, required fatigue life, no buckling, acceptable contact pressure, or another measurable criterion.
-
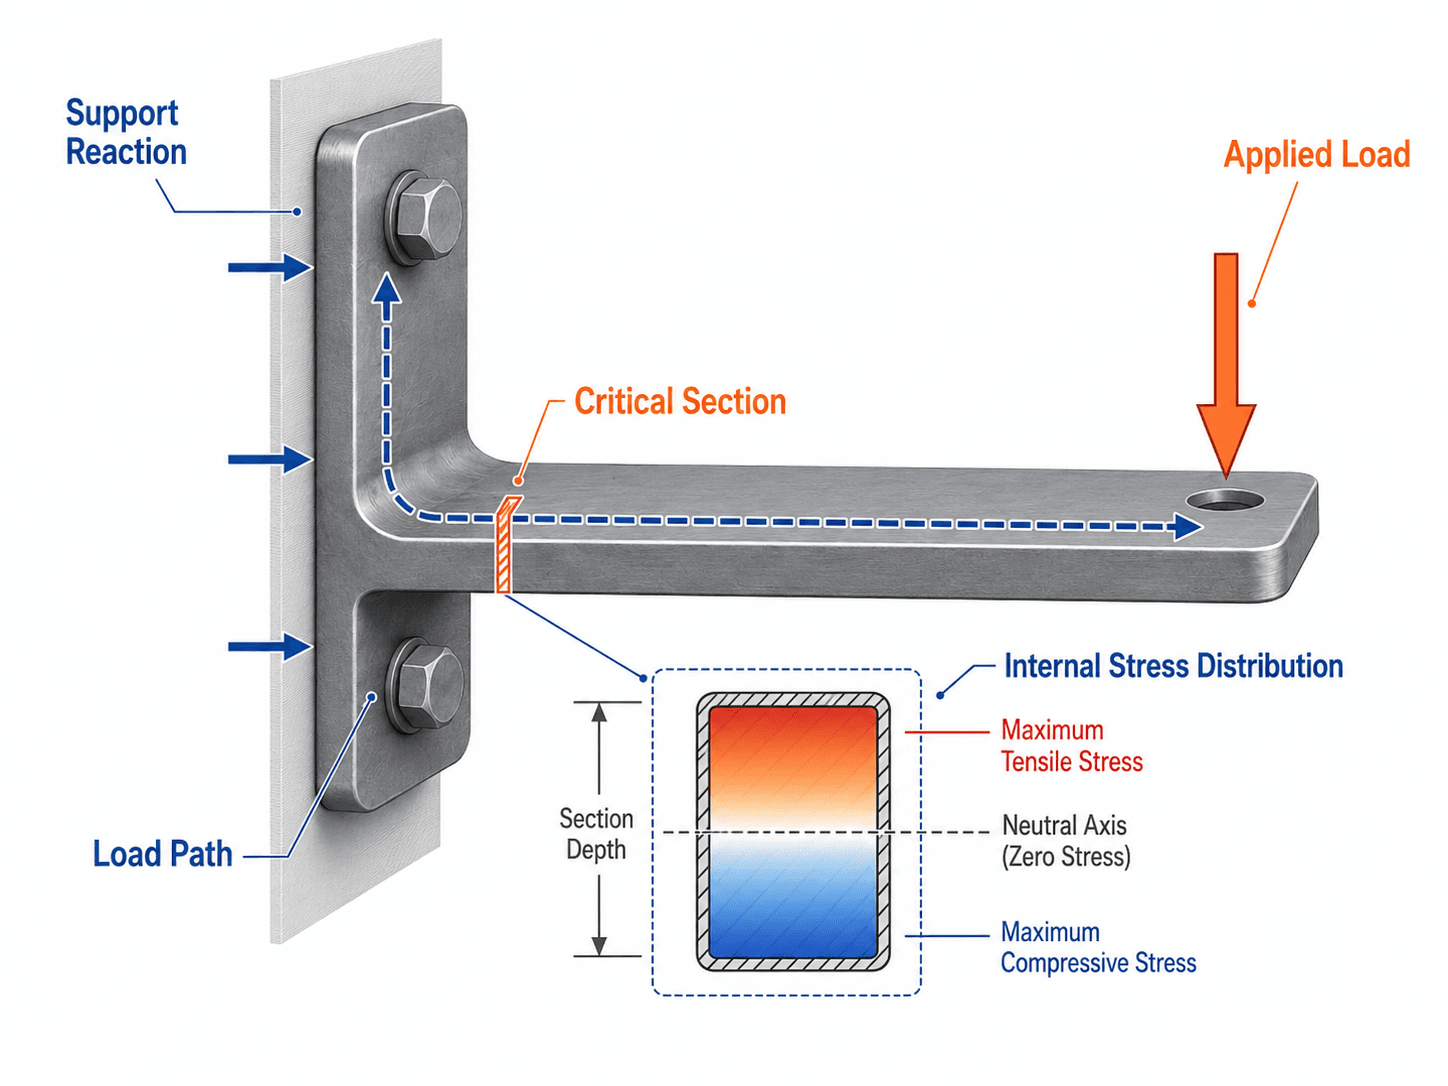
Identify the real load path.
Determine where loads enter, where reactions occur, and which bolts, welds, bearings, sections, joints, or contact surfaces transfer the load between them.
-
Choose an appropriate analysis method.
Use hand equations for transparent idealized problems, FEA for complex distributions and interactions, and testing when uncertainty, nonlinearity, or validation needs justify it.
-
Calculate response.
Determine reaction loads, internal force and moment, stress, strain, deflection, or other relevant response at the locations that can control the design.
-
Apply the correct failure criterion.
Compare the result with yield, fracture, fatigue, buckling, contact, creep, serviceability, or another criterion that represents the actual risk.
-
Review and document the evidence.
Check sensitivity to assumptions, units, mesh, boundary conditions, and material data, then document the conclusion and limitations clearly enough for independent review.
Choose the simplest method that answers the real question
Then: the load path is clear, geometry is idealizable, and beam, shaft, pressure, fastener, or section-property equations represent the behavior well enough for sizing or an independent check.
Then: geometry, contact, multiple load paths, local stiffness, load sharing, or stress distribution is too complex for one-dimensional closed-form equations.
Then: plasticity, large displacement, changing contact, hyperelasticity, instability, preload-dependent behavior, or other nonlinear effects materially change the answer.
Then: model uncertainty is significant, failure consequence is high, real interfaces are difficult to reproduce analytically, or validation of the assembled product is required.
NASA stress-analysis guidance emphasizes a documented, reviewable analysis with explicit assumptions, loads, substantiation, and conclusions: NASA — Preparation of Stress Analysis Reports.
Key Takeaways
- Start with load path: the quality of the load case and support model often matters more than the sophistication of the solver.
- Match stress to failure mode: a von Mises value, principal stress, fatigue range, contact pressure, or buckling eigenvalue answers different questions.
- Peak stress needs interpretation: local geometry, mesh refinement, idealized constraints, and stress singularities can produce impressive-looking numbers that are not valid design stresses.
How Loads Become Stress: Tension, Shear, Bending, and Torsion
External forces and moments are carried internally through axial force, shear force, bending moment, torque, bearing/contact load, or combinations of these actions.
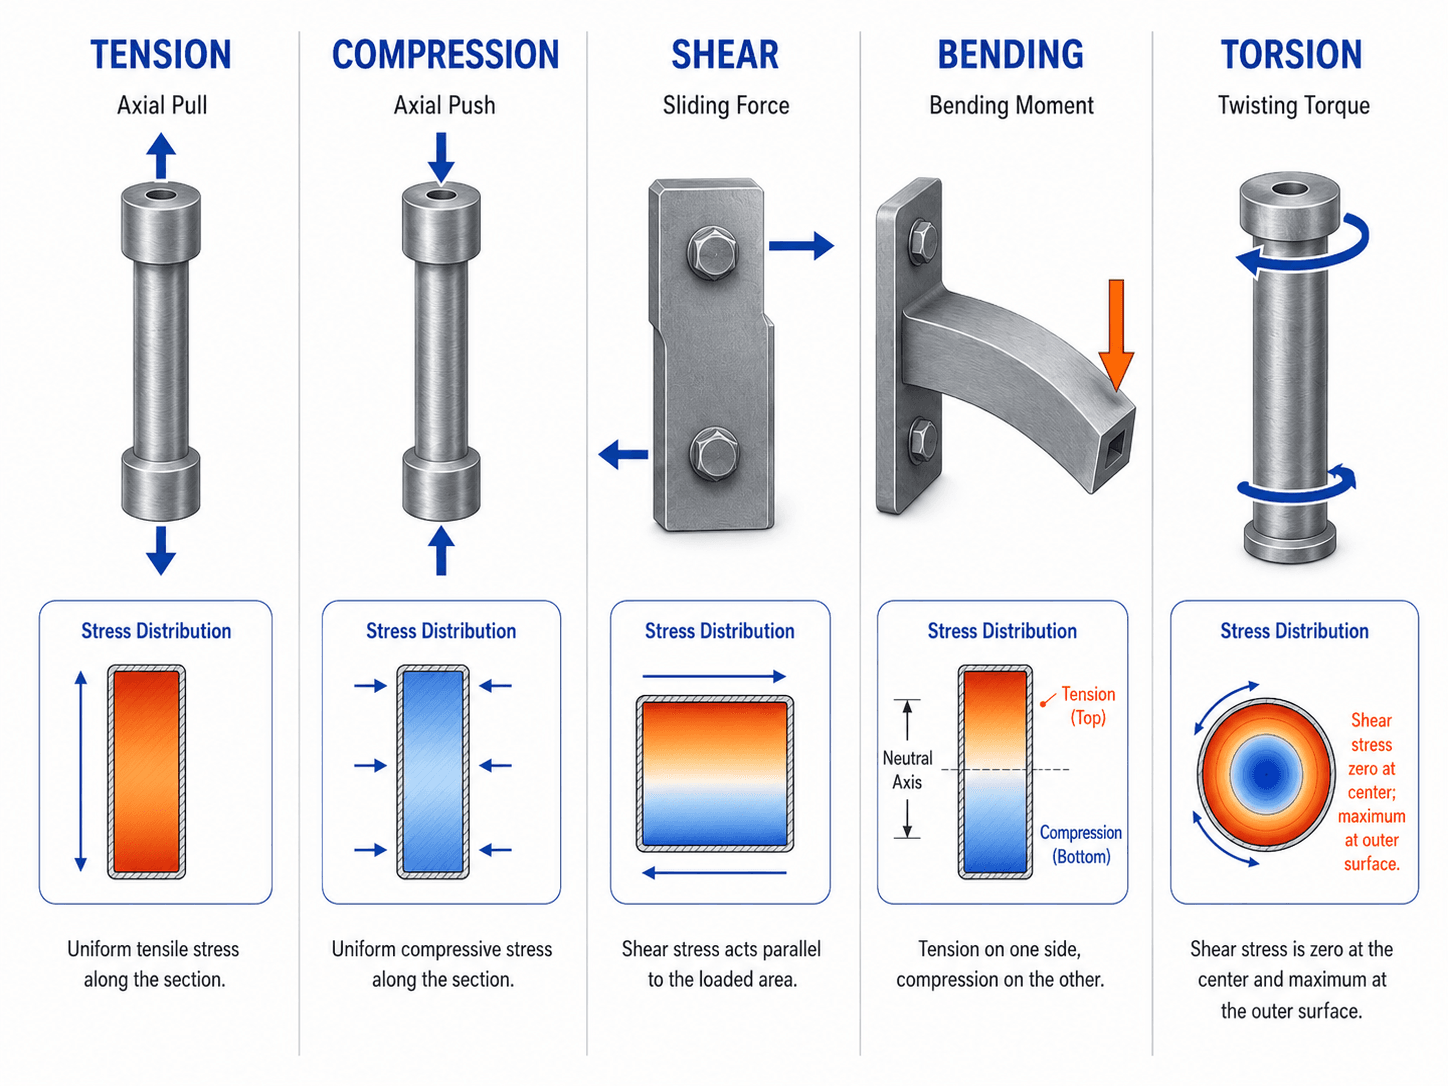
Tension and compression
Axial tension or compression creates normal stress across a resisting area. For a uniform prismatic member loaded through its centroid, the average axial stress can be adequate for first-pass sizing. Local holes, threads, load introduction, contact, eccentricity, or changing cross sections require more detailed treatment.
Direct and transverse shear
Shear occurs in pins, bolts, keys, weld groups, webs, joints, and beam sections. The simple average relation \(V/A\) is useful only when its assumptions match the geometry. Actual shear distribution through a beam or thin-walled section can be strongly nonuniform.
Bending
Bending creates a normal-stress gradient across the cross section. In linear elastic beam theory, stress is zero at the neutral axis and increases with distance from it. Brackets, shafts, frames, levers, and supports often fail or fatigue near regions where bending moment combines with a reduced section or stress concentration.
Torsion
Torque creates shear stress. The familiar \(Tc/J\) relation is directly applicable to circular shafts under Saint-Venant torsion; noncircular, open, thin-walled, or restrained sections can have different stress and warping behavior.
Thermal and contact loading
Temperature changes can create stress when expansion is restrained or gradients distort the part. Contact loads in bearings, gears, cams, pins, bushings, and clamped interfaces can create highly localized pressure and subsurface stress that cannot be represented by a gross-area normal-stress calculation.
Core Stress Analysis Equations
Closed-form equations are powerful because their assumptions are visible. Use them for preliminary sizing, independent FEA checks, and simple components when geometry and boundary conditions match the underlying mechanics.
Axial normal stress
Engineering strain
Linear elastic Hooke’s law
Elastic bending stress
Circular-shaft torsional shear
Nominal-to-local elastic stress
- FAxial or internal force. Use a consistent force unit such as N or lbf.
- ARelevant resisting area. The correct net or effective area depends on geometry and load path.
- EElastic modulus for the material and condition being analyzed.
- MBending moment at the section of interest.
- ISecond moment of area about the applicable bending axis.
- TTorque acting through the section.
- JPolar second moment of area for the applicable circular-shaft torsion model.
- KtTheoretical elastic stress-concentration factor for the geometry and loading mode.
Engineering meaning: Equations are trustworthy only inside their assumptions. A correct formula with the wrong section property, load path, effective area, boundary condition, material model, or stress-concentration treatment still produces the wrong engineering conclusion.
Which Stress Result Should You Use?
Choose the reported stress or response quantity based on the credible failure mechanism and material behavior—not on whichever contour plot has the largest number.
Von Mises stress
Commonly used to evaluate onset of yielding in isotropic ductile metals under multiaxial static stress. It reduces the stress state to a scalar equivalent value associated with distortional energy.
Principal stresses
Useful for understanding tensile and compressive extremes and often more relevant to brittle cracking, opening-mode fracture concerns, and situations where normal stress orientation matters.
Shear stress
Important for pins, keys, shafts, interfaces, welds, and materials or failure modes where shear governs. The correct component or invariant depends on the design method.
Principal stresses for a plane-stress state
For a two-dimensional stress state with normal stresses \(\sigma_x\) and \(\sigma_y\) and in-plane shear \(\tau_{xy}\), the principal stresses are the normal stresses acting on orientations where the in-plane shear stress is zero. They are useful for understanding the most tensile and most compressive directions at a point.
Von Mises stress for plane stress
For isotropic ductile materials under a plane-stress condition, the von Mises equivalent stress can be calculated directly from the in-plane components. It is an equivalent scalar used for a ductile-yield check; it is not a physical normal stress acting on a specific plane.
Von Mises stress from three principal stresses
The same criterion can be written in terms of the three principal stresses. This form makes clear that yielding depends on differences between principal stresses rather than hydrostatic stress alone.
Report the quantity tied to the acceptance criterion. For example, von Mises stress may support a static ductile-yield check, maximum principal stress may help assess tensile cracking or brittle behavior, and a fatigue analysis may require alternating/mean stress or another cycle-based measure at the critical location.
Factor of safety
Factor of safety is meaningful only when the allowable and demand correspond to the same failure mode, material condition, reference basis, and load case.
Margin of safety
Buckling, contact, creep, and serviceability
Some designs are not controlled by a conventional stress allowable at all. Slender compression members may buckle; gears and bearings may be limited by contact fatigue; polymers and hot metals can be time-dependent; seals and precision mechanisms may be controlled by deflection rather than strength. For a broader failure taxonomy, see Failure Modes.
MIT’s Mechanical Behavior of Materials coursework covers elastic and plastic deformation, fracture, and fatigue as distinct material-response and failure topics: MIT OpenCourseWare — Mechanical Behavior of Materials.
Stress Concentrations and Fatigue Analysis
Fatigue can cause failure below static yield strength, especially where holes, shoulders, threads, keyways, weld toes, scratches, corrosion pits, or other discontinuities amplify cyclic stress.
Theoretical stress concentration
The elastic factor \(K_t\) describes the local stress amplification caused by geometry in an ideal elastic model. It is not automatically the fatigue factor used in every fatigue method. Material notch sensitivity, local plasticity, gradient effects, surface condition, and the selected fatigue approach can change how the local feature is treated.
Alternating and mean stress
A cyclic load is commonly described by an alternating component and a mean component. A fully reversed cycle has a different fatigue effect than a pulsating load with the same maximum stress, so fatigue cannot generally be reduced to “maximum stress divided by yield strength.”
Choose a fatigue method that matches the problem
High-cycle metallic design may use stress-life data and mean-stress correction; low-cycle problems may require strain-life methods; welded structures often use detail-category or structural-stress approaches; variable-amplitude loading can require cycle counting and cumulative-damage methods. The method should match the material, geometry, loading history, manufacturing detail, and governing design basis.
For deeper material context, see Failure Mechanisms and Material Selection.
How to Interpret FEA Stress Results Correctly
Finite element analysis is a numerical method for approximating structural response; its credibility depends on the mathematical model, element formulation, mesh, material behavior, contacts, loads, and constraints—not the visual polish of the contour plot.
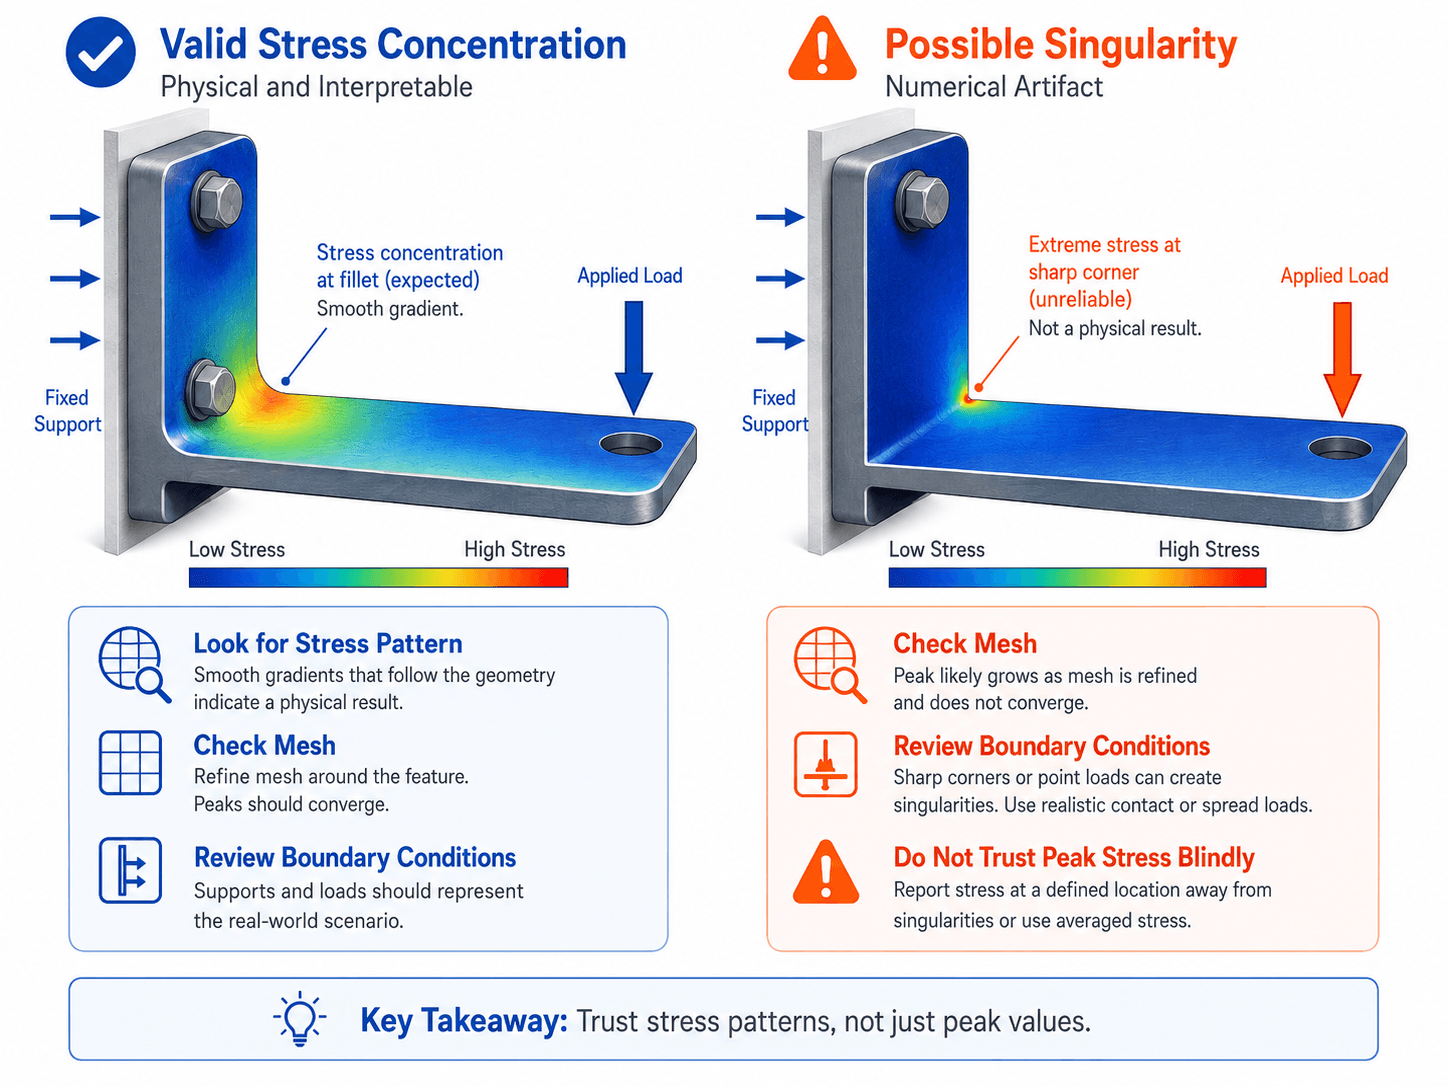
Boundary conditions can dominate the answer
A “fixed” face in a model implies zero motion at the constrained degrees of freedom. Real bolts, welds, bearings, frames, and housings have stiffness and load-transfer behavior. Overly rigid constraints can shift the load path, suppress deformation, or create artificial local stress near the fixture.
Model how load actually enters the part
Point forces, rigid remote loads, bearing loads, bolt pretension, pressure, distributed traction, contact, and imposed displacement can produce very different local fields. Select the representation that matches the real interface and use a simplified load only when the resulting limitation is understood.
Check mesh convergence where the result matters
Refine the mesh around critical gradients and compare a response quantity that should converge: displacement, strain energy, reaction load, averaged or path stress, or a physically meaningful local stress away from a singularity. More elements do not fix a bad model automatically.
Use a convergence check, not just a fine mesh
- Establish a baseline: solve with a mesh that captures the global geometry and load path, then record reactions, displacement, and the stress quantity you intend to use.
- Refine the critical region: reduce element size or improve element order/quality where stress gradients are important without changing the physical model.
- Compare meaningful outputs: reaction forces should remain in equilibrium, global displacement should stabilize, and a physically finite local stress should approach a stable value.
- Interpret nonconvergence: if only the pointwise peak keeps increasing near a sharp corner, point load, or rigid constraint while surrounding response stabilizes, investigate a singularity instead of declaring the design failed from the raw maximum.
Displacement, reaction force, strain energy, section force, stress along a path away from a singular point, or another quantity tied to the design criterion often provides a more useful convergence measure than the single highest elemental or nodal stress.
Recognize stress singularities
At certain idealized sharp corners, crack tips, point loads, or abrupt boundary-condition changes, the continuum solution can be singular. In those regions, the maximum nodal or elemental stress may rise as the mesh is refined rather than approaching a finite value. The engineer must use a method appropriate to the physical feature—such as realistic geometry, stress linearization, structural/hot-spot stress, fracture mechanics, a code rule, or another validated local approach.
Know when linear analysis stops being adequate
Linear static FEA assumes, among other things, sufficiently small deformations and linearized material behavior for the chosen formulation. Contact changes, plasticity, large displacement, hyperelasticity, instability, preload-dependent behavior, and other nonlinear effects can require nonlinear analysis.
MIT’s finite-element course describes FEA as a method for complex static and dynamic engineering problems and explicitly distinguishes linear and nonlinear analysis: MIT OpenCourseWare — Finite Element Procedures for Solids and Structures. NASA technical literature documents that stresses at singularities can grow with mesh refinement rather than converge to a finite peak: NASA NTRS — Negative Stress Margins: Are They Real?.
Practical FEA decision: If a hand calculation and FEA disagree substantially, do not average the answers. Reconcile the load path, section properties, constraints, contacts, units, and output definitions until the reason for the difference is understood.
For a dedicated simulation guide, continue to Finite Element Analysis.
Worked Example: Cantilever Bracket Bending Stress
Preliminary root-section check
A cantilever steel bracket carries a 500 N downward load 0.20 m from the root. The net section at the root has an elastic section modulus of \(2.5\times10^{-6}\,\mathrm{m^3}\). For this simplified example, use a material yield strength of 250 MPa and assume linear elastic behavior with no local stress concentration included yet.
Calculate the root bending moment
The cantilever root carries the maximum bending moment for this idealized load case.
Calculate nominal bending stress
Use the supplied section modulus to convert the root moment into elastic bending stress.
Calculate the simple yield factor of safety
Compare the nominal bending stress with the stated yield strength for this simplified static check.
Units reduce correctly: N·m divided by m³ gives N/m², or pascals.
The calculation excludes fillet concentration, bolt-group behavior, local bearing, shear, fatigue, deflection, and flexibility of the supporting structure.
Review the root fillet, attachment, load distribution, repeated-load history, and deflection before treating the design as release-ready.
Senior Engineer Stress Analysis Review Checklist
Use this before accepting a hand calculation, FEA model, or stress report. A technically correct analysis should be auditable by someone who did not create it.
- Requirement: Is the analysis checking a clearly defined strength, life, stability, deformation, or contact requirement?
- Load cases: Are operating, startup, shutdown, overload, handling, assembly preload, thermal, vibration, impact, and credible misuse considered where relevant?
- Load path: Can every applied load be traced to realistic reactions through the modeled structure and interfaces?
- Boundary conditions: Do fixtures, bolts, welds, bearings, symmetry planes, and contacts represent the real assembly stiffness adequately?
- Material data: Are elastic modulus, yield/ultimate values, fatigue properties, temperature effects, anisotropy, heat treatment, weld condition, or print direction appropriate?
- Failure criterion: Is the reported stress or response matched to the actual failure mode rather than automatically compared with yield strength?
- Stress concentrations: Are holes, fillets, threads, shoulders, grooves, keyways, weld toes, cutouts, and other local features represented or conservatively treated?
- Mesh: Are element type, quality, order, local refinement, and convergence adequate for the response quantity being used?
- Singularities: Are nonconvergent local peaks identified and evaluated with a physically meaningful method instead of reported blindly?
- Equilibrium: Do applied forces and moments agree with reactions, and do hand estimates support the general magnitude and load path?
- Deformation: Is the deflected shape physically plausible, and are functional clearances or alignment requirements satisfied?
- Fatigue: For cyclic duty, are stress range, mean stress, life, notch effects, surface condition, and the chosen fatigue methodology documented?
- Documentation: Could another engineer reproduce the conclusion from the stated geometry, loads, materials, assumptions, methods, and results?
Common Stress Analysis Mistakes and When Simple Methods Break Down
Most serious stress-analysis errors come from an incorrect model of reality rather than an arithmetic mistake.
- Using unrealistic fixed supports: infinitely rigid constraints can change load sharing, deformation, and local stress compared with real bolted, welded, bearing, or frame-supported interfaces.
- Applying a point load where load is distributed: local stress can become artificial when a pin, washer, pressure patch, bearing, contact surface, or weld actually spreads the load.
- Reading the red contour as the answer: color limits are visualization choices; the underlying stress value, location, convergence, failure criterion, and physical meaning determine whether it matters.
- Ignoring stress concentrations: smooth nominal calculations can miss crack-initiation sites at fillets, holes, threads, keyways, grooves, and weld toes.
- Using von Mises for every failure mode: ductile yielding, brittle fracture, fatigue, buckling, contact fatigue, creep, and composite failure require different interpretations.
- Assuming linear elasticity after yield: once plasticity, large deformation, contact-status change, instability, or strong material nonlinearity becomes important, a linear elastic solution may no longer represent the response.
- Ignoring deflection because stress is low: alignment, sealing, gear mesh, bearing life, optical positioning, and user function can fail from deformation long before strength is exhausted.
- Skipping an independent estimate: reaction loads, beam theory, pressure × area, section-property estimates, or order-of-magnitude calculations are valuable checks against an incorrect solver setup.
Move beyond simple linear stress analysis when plasticity, large deformation, nonlinear contact, buckling, fracture, creep, hyperelasticity, composite failure, severe thermal gradients, complex fatigue loading, or safety-critical uncertainty materially affects the design conclusion.
ANSYS documentation notes that structural stress results can be particularly sensitive to mesh quality, and its nonlinear-analysis guidance distinguishes cases involving large-strain or nonlinear material behavior: ANSYS Mechanical APDL Modeling and Meshing Guide.
Stress Analysis Engineering References
These sources support the mechanics, finite-element, singularity, material-behavior, and reporting concepts used on this page. Actual designs must use the current project requirements, applicable codes or standards, verified material data, and appropriate component-specific methods.
- NASA — Preparation of Stress Analysis Reports Formal guidance for documenting assumptions, loads, analysis substantiation, conclusions, and reviewable stress-analysis evidence.
- MIT OpenCourseWare — Finite Element Procedures for Solids and Structures Primary educational source on effective finite-element procedures for linear and nonlinear analysis of engineering solids and structures.
- MIT OpenCourseWare — Mechanical Behavior of Materials Covers elastic/plastic deformation, fracture, fatigue, creep, and other material behavior relevant to choosing an appropriate failure criterion.
- NASA NTRS — Negative Stress Margins: Are They Real? Discusses finite-element stress singularities and the problem of mesh-dependent local stresses.
- ANSYS — Mechanical APDL Modeling and Meshing Guide Current primary solver documentation on modeling, meshing, element quality, and stress-analysis considerations.
Frequently Asked Questions
What is stress analysis in mechanical engineering?
Stress analysis determines how loads and constraints create internal stress, strain, deformation, and failure risk in a component or assembly. Engineers use it to check strength, stiffness, fatigue, buckling, contact, fracture, and other credible failure modes.
Is stress analysis the same as FEA?
No. FEA is one numerical method used in stress analysis. Stress analysis can also use free-body diagrams, hand calculations, beam or shaft equations, fatigue methods, test data, inspection evidence, and engineering judgment.
Should I use von Mises stress or principal stress?
Use the result that matches the failure criterion. Von Mises stress is commonly used for yielding of isotropic ductile metals. Principal stresses are useful for tensile/compressive extremes and may be more relevant to brittle or fracture-type concerns. Fatigue, composites, contact, buckling, and creep can require different quantities and methods.
How do I know whether an FEA stress peak is a singularity?
A warning sign is a peak at an idealized sharp corner, point load, or constraint edge that keeps increasing as the mesh is refined instead of approaching a stable value. Review the geometry and boundary condition, examine convergence away from the point, and use a local assessment method appropriate to the real physical feature.
Can a part fail even if stress is below yield strength?
Yes. Fatigue, brittle fracture, buckling, excessive deflection, contact damage, wear, creep, corrosion-assisted cracking, and other mechanisms can control below a simple static yield limit.
Summary and Next Step
Stress analysis is not a single equation or FEA contour. It is a chain of engineering reasoning that starts with the real load path, models the component at an appropriate level of fidelity, and compares the resulting response with the failure criterion that actually governs the design.
The strongest analyses are easy to audit: loads balance, assumptions are explicit, hand estimates agree with the general response, critical local features are treated intentionally, and limitations are documented instead of hidden behind numerical precision.