Key Takeaways
- Definition: Transportation planning is the long-range process of deciding how people and goods should move across a city or region, which modes to prioritize, and which projects should be funded and built.
- Application: Engineers and planners use it to identify problems, analyze data, compare alternatives, and build a coordinated program of roads, transit, walking, biking, and freight improvements.
- Outcome: After reading this guide you will understand the standard planning workflow, the data and models involved, and how transportation planning connects to detailed design and operations.
- Context: Transportation planning sits at the interface of civil engineering, urban planning, and policy, translating community goals into technically defensible projects and investment strategies.
Table of Contents
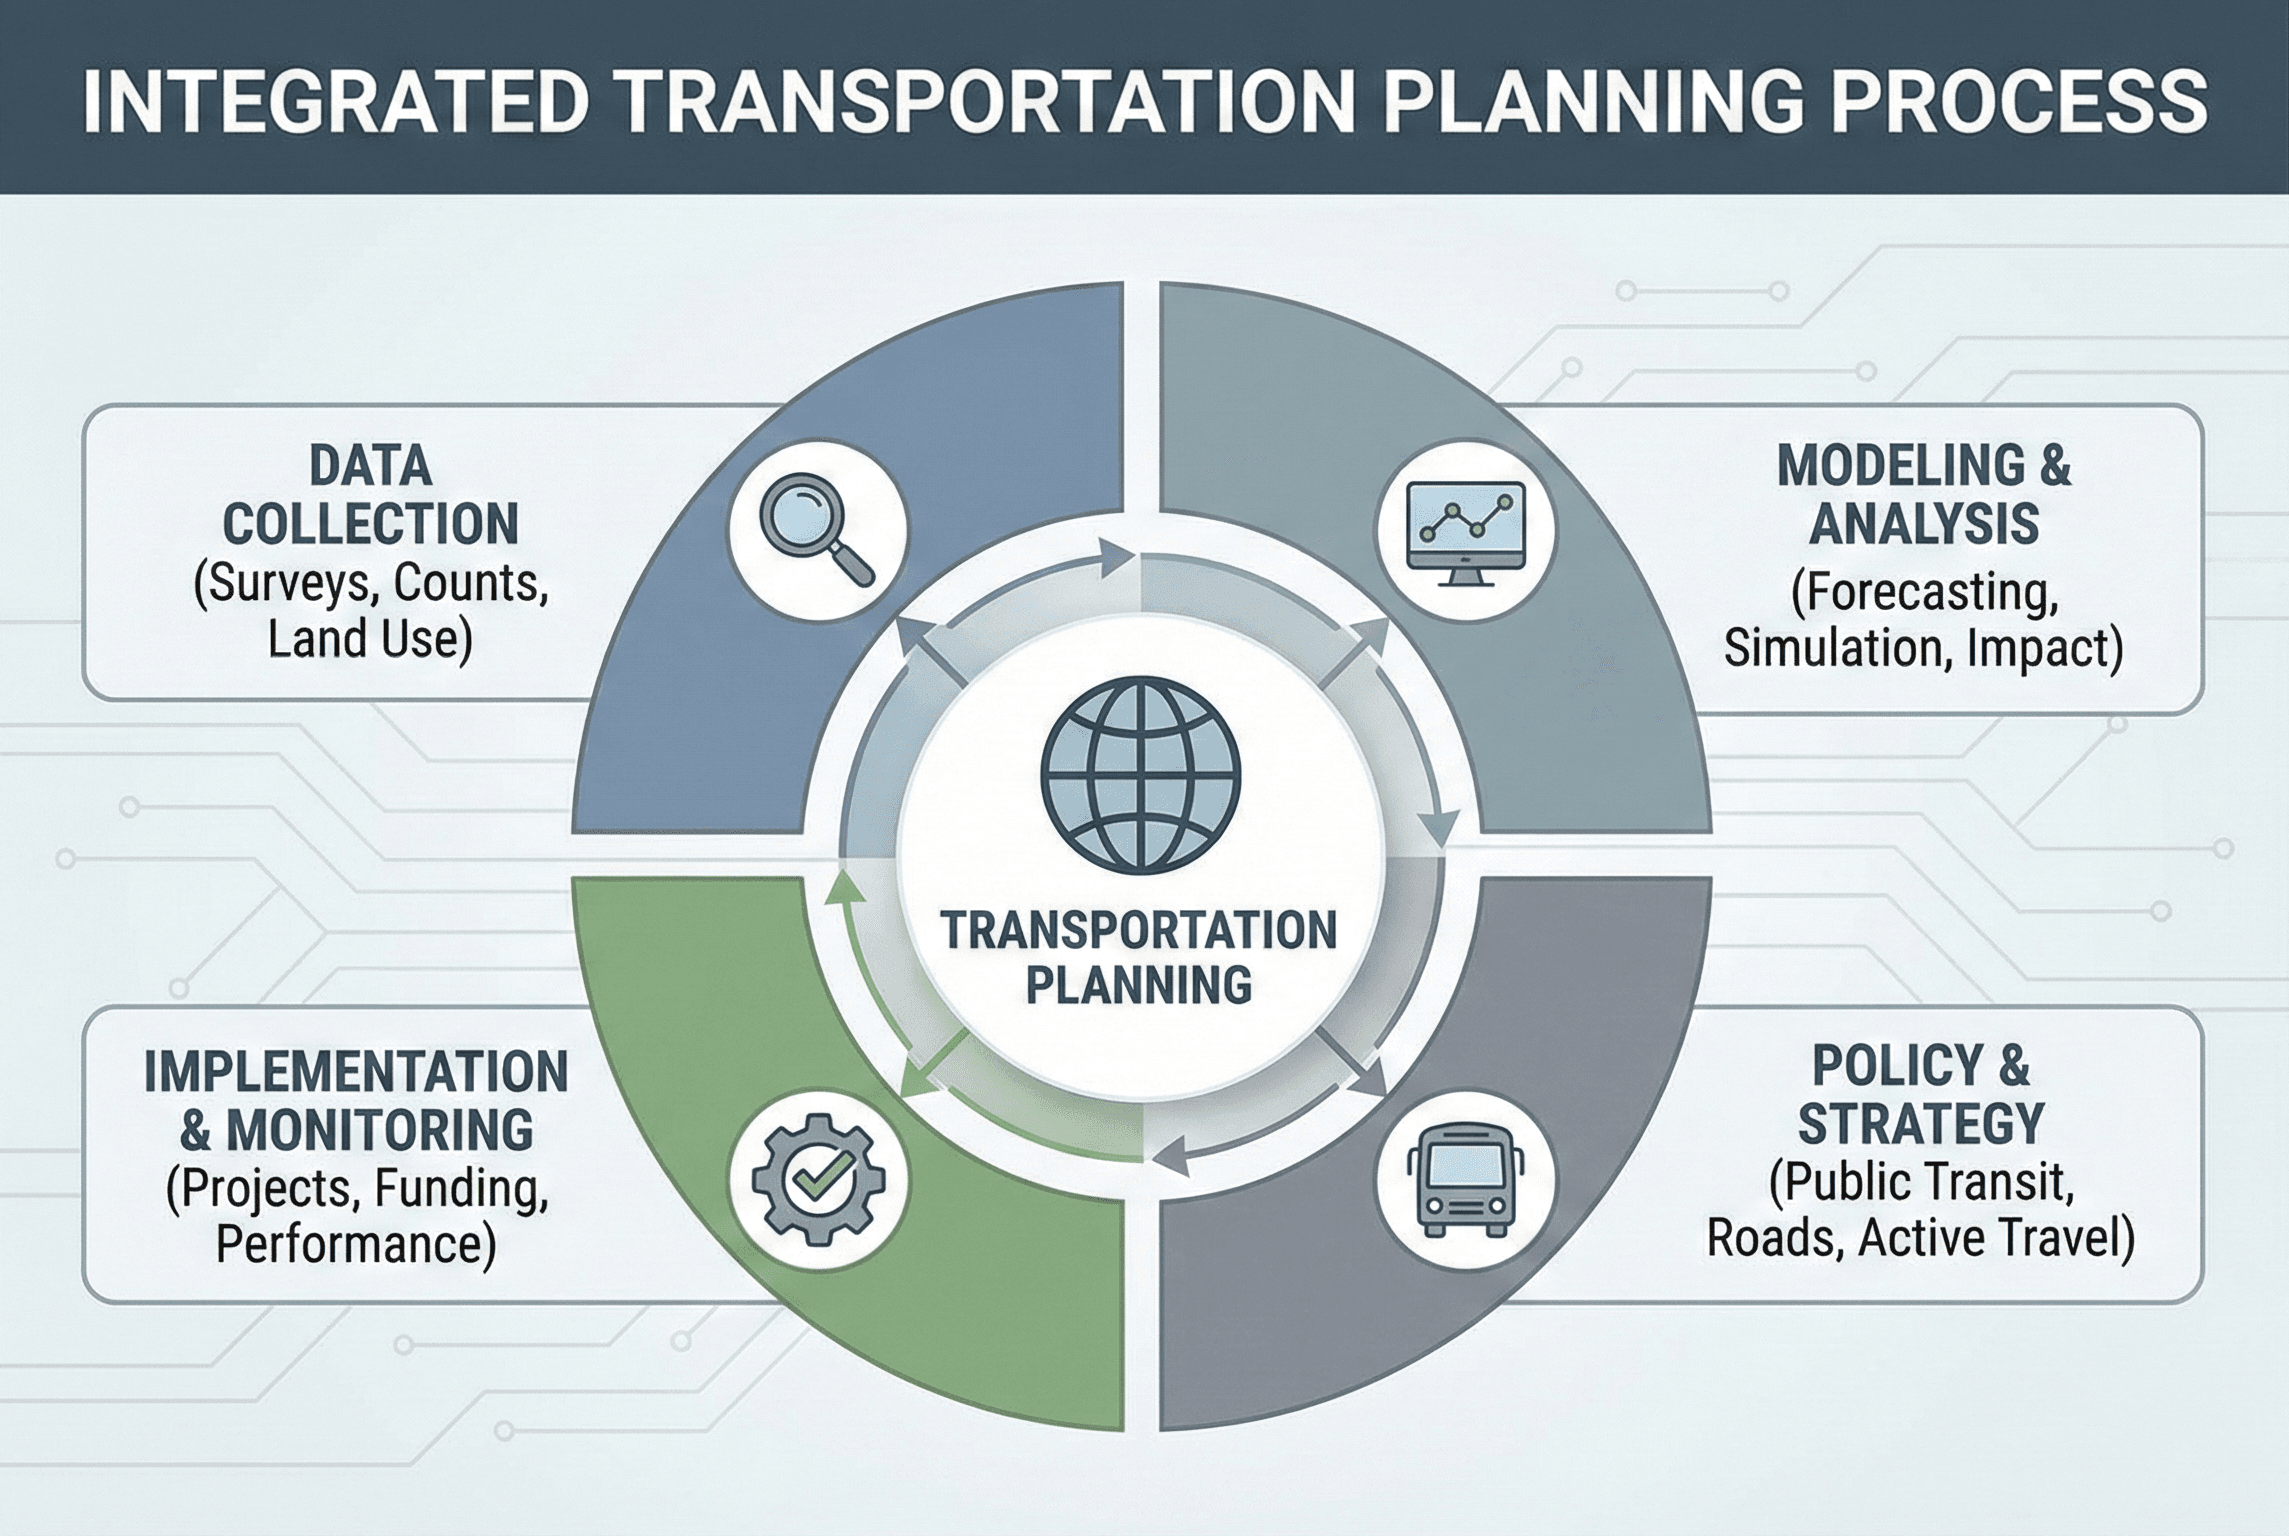
Featured diagram
Introduction
Transportation planning is the bridge between high-level community goals and the detailed designs that civil engineers eventually build. Instead of starting with lane widths and signal phasing, planners start with questions: How should people and goods move across this region? Where are the biggest safety problems? Which projects will provide the most benefit per dollar, and how should they be phased over 5, 10, or 30 years? To answer these questions, transportation planners combine data analysis, modeling, engineering judgment, and public input into a structured process.
This page walks through that process from an engineering perspective. You will see how transportation planning fits within civil and transportation engineering, the typical workflow for corridor and regional plans, the most important data and models, and how performance measures like safety, capacity, and accessibility shape decisions. Whether you are a student, an early-career engineer, or a practitioner shifting toward planning work, this guide is designed to give you a clear, realistic picture of what transportation planning actually looks like in practice.
What is transportation planning?
At its core, transportation planning is a structured way of deciding how to improve a transportation system over time. Planners and engineers examine how people currently travel, where congestion and crashes occur, how land use is evolving, and what the community values (for example, reliability, climate goals, or safe walking and biking). They then translate those needs into projects, policies, and programs that can be funded, designed, and built.
Unlike pure policy documents, transportation plans are grounded in engineering reality. They consider available right-of-way, geometric constraints, design standards, constructability, and long-term maintenance. At the same time, they operate at a higher level than detailed road or intersection design. A single plan might identify the need for a bus-priority corridor, but the exact lane assignments, signal timings, and curb details will be handled later during design and traffic engineering.
Key objectives of transportation planning
Most transportation plans revolve around a consistent set of objectives:
- Mobility and reliability: ensuring people and goods can move efficiently, with predictable travel times during both typical and peak conditions.
- Safety: reducing the frequency and severity of crashes, especially for vulnerable road users such as pedestrians, cyclists, and motorcyclists.
- Accessibility: connecting people to jobs, schools, healthcare, and other key destinations within reasonable travel times and costs.
- Sustainability and resilience: supporting lower-emission modes, minimizing environmental impacts, and ensuring the network can withstand disruptions such as storms or construction.
- Equity: making sure benefits and burdens of transportation investments are not concentrated in only a few neighborhoods or user groups.
Good transportation planning makes these objectives explicit and ties them to measurable performance metrics so engineers can evaluate whether a proposed project actually moves the system toward the desired outcomes.
How transportation planning fits within civil and transportation engineering
Transportation planning sits alongside traffic engineering, geometric design, pavement design, and transportation operations as a core part of the broader transportation engineering discipline. Whereas traffic engineering tends to focus on individual intersections, corridors, and control devices, planning operates at the network and system level: cities, regions, corridors, and modal networks such as transit, freight, and active transportation.
Planning vs. design vs. operations
A typical project life cycle illustrates the division of roles:
- Planning: identifies the need for a project (for example, a new interchange or bus rapid transit line), evaluates alternatives, and recommends a preferred solution in a plan or study.
- Design: converts that preferred solution into detailed drawings and specifications, following standards such as AASHTO, HCM, and MUTCD.
- Operations: manages the system once it is built, adjusting signal timing, transit schedules, incident response, and work-zone phasing to keep traffic flowing and maintain safety.
Transportation planning must therefore be detailed enough that engineers can realistically design and operate what is proposed, but flexible enough to allow optimization during later phases.
Intersections with land use and policy
Transportation systems do not exist in isolation: they are tightly linked to land use and policy. A new transit line can unlock higher-density development; a new freeway interchange can induce growth at the fringe of a metropolitan area. Transportation planning works in parallel with land use planning, environmental review, and funding policy to ensure projects are not only technically sound but aligned with long-term growth scenarios, climate strategies, and regional economic goals.
Data, models, and key quantitative relationships
Modern transportation planning is data-hungry. Planners rely on observed traffic counts, origin–destination data, transit ridership, land use records, socioeconomic projections, and crash histories. These inputs are fed into models that estimate how people will respond to new infrastructure, policy changes, or land use patterns. Even when high-end software is used, the underlying math is built on a few core relationships.
Traffic flow relationships
At the corridor level, planners use simplified traffic flow relationships to sanity-check volumes and speeds. A common conceptual relationship is:
Here \(Q\) is traffic flow or volume (vehicles/hour), \(k\) is density (vehicles/km or vehicles/mi), and \(v\) is space-mean speed (km/h or mph). This relationship reminds engineers that for a given lane, there is a tradeoff between speed and density; very high densities tend to reduce speeds and therefore overall flow. While detailed capacity analysis is handled using methodologies from the Highway Capacity Manual (HCM), this simple equation helps planners check whether modeled flows and speeds are at least directionally reasonable.
- Q Flow or volume, typically in vehicles/hour or persons/hour for a given lane or facility.
- k Density, in vehicles/km or vehicles/mi; increases as more vehicles occupy the same segment.
- v Space-mean speed, in km/h or mph; tends to decrease as density increases beyond stable flow ranges.
Travel demand and scenario modeling
For regional plans, engineers often use travel demand models (TDMs) that implement the classic four-step process: trip generation, trip distribution, mode choice, and route assignment. Each step applies statistical or choice models that relate trip patterns to land use, demographics, network characteristics, and travel times. Scenario modeling then compares different futures, such as a “build” alternative with new transit lines or managed lanes versus a “no-build” baseline.
Even if you are not the one building the model, it is crucial to understand its assumptions: network coding, value of time, elasticity of demand, and how non-motorized modes are represented. Transportation planners should treat model outputs as one source of evidence, to be combined with observed data, stakeholder input, and professional judgment.
When reviewing model results, always anchor them to something observable. Compare modeled base-year volumes to counts, modeled speeds to probe data, and modeled transit boardings to ridership. Large inconsistencies may indicate coding errors or unrealistic assumptions that should be fixed before using the model to justify major investments.
The transportation planning process: step-by-step
Although every agency has its own terminology, most transportation planning efforts follow a similar sequence. Understanding this workflow helps you see where different engineering tools and deliverables fit.
- Define goals, objectives, and performance measures. Start by clarifying what the community is trying to achieve (for example, reduce serious crashes, cut greenhouse gas emissions, or improve transit access) and choose metrics to track progress.
- Diagnose current conditions and problems. Analyze traffic counts, travel times, crash data, land use, and demographic information to understand where the network is underperforming and why.
- Develop and screen alternatives. Brainstorm a wide set of potential solutions (e.g., signal retiming, new transit service, road diets, new connections, pricing strategies) and quickly screen out those that are infeasible or ineffective.
- Analyze impacts and tradeoffs. For the most promising alternatives, perform more detailed analysis: capacity and level-of-service estimates, safety impacts, multimodal connectivity, environmental and right-of-way impacts, and high-level costs.
- Engage stakeholders and refine. Share findings with the public, agencies, and stakeholders. Incorporate feedback to refine alternatives, address concerns, and build consensus.
- Select a preferred alternative and implementation plan. Document the recommended projects, phasing, approximate costs, and funding strategy in a plan or study that can feed into programming and design.
Experienced engineers will ask whether the preferred alternative clearly addresses the stated problems, whether key risks (such as right-of-way, utility conflicts, or permitting) have been considered, and whether the performance improvements justify the cost. If those questions cannot be answered convincingly, the planning work is not done yet.
Example: planning a bus-priority corridor
To see the planning process in action, consider an arterial corridor that connects a growing suburban area to a downtown. Today it carries high bus ridership but suffers from recurring congestion, long travel times, and multiple high-injury crash locations for pedestrians.
Example
Planners begin by analyzing existing data: transit on-time performance, bus stop spacing, intersection delay, and crash patterns. They define objectives such as improving bus travel time reliability by 20%, reducing serious injuries along the corridor, and maintaining reasonable access for freight deliveries. Alternatives may include dedicated bus lanes, queue-jump lanes at signals, transit signal priority, consolidated bus stops, and improved crossings for pedestrians and cyclists.
Using volume–capacity estimates, microsimulation, or simpler analytical tools, the team compares how each alternative affects person throughput, delay for general-purpose traffic, and safety conflicts. They also coordinate with the geometric design team to confirm that proposed cross-sections fit within the right-of-way. Through stakeholder meetings and public workshops, the team refines a preferred alternative that balances transit benefits with local business access, documenting the results in a corridor plan that can move into design and implementation.
Common pitfalls and practical checks in transportation planning
Because transportation planning spans long time horizons and involves many assumptions, it is easy to make mistakes that seem small on paper but have large real-world impacts. Recognizing common pitfalls will make your plans more robust and defensible.
- Over-relying on model outputs without validating them against observed data or professional judgment.
- Focusing solely on vehicle level of service while neglecting safety, transit, and walkability.
- Ignoring induced demand and assuming that added capacity will permanently “solve” congestion.
- Underestimating implementation risks such as right-of-way, utilities, permitting, or political feasibility.
A frequent mistake is designing corridor plans around peak-hour vehicle LOS targets without accounting for safety and multimodal access. This can lead to overly wide, high-speed facilities that may move cars efficiently for a few hours a day but perform poorly for pedestrians, cyclists, transit users, and safety outcomes across the entire day.
The table below summarizes a few critical parameters that transportation planners routinely check when reviewing alternatives.
| Parameter | Symbol | Typical units | Notes |
|---|---|---|---|
| Volume-to-capacity ratio | v/c | dimensionless | Indicates how close a facility is to capacity; values near 1.0 suggest potential breakdown and unstable flow. |
| Crash rate | R | crashes per million vehicle-km (or mi) | Used to compare safety performance across facilities with different volumes and lengths. |
| Person throughput | PT | persons/hour | Counts people moved rather than vehicles; critical for evaluating transit and active modes. |
| Access to key destinations | Acc | % of population within X minutes | Measures how well the network connects residents to jobs, schools, and services by various modes. |
Work with real numbers
Engineering calculators & equation hub
Jump from theory to practice with interactive calculators and equation summaries covering civil, mechanical, electrical, and transportation topics.
Visualizing transportation planning
A powerful way to understand transportation planning is to visualize a single corridor or network as a series of layers. One layer shows existing traffic volumes and speeds, another shows transit routes and frequencies, a third shows sidewalks, bike lanes, and crossing locations, and another overlays land uses and key destinations.
For a future illustration, imagine a cross-section and plan view of an urban arterial with cars, buses, cyclists, and pedestrians, with arrows and callouts highlighting travel demand, person throughput, crash hot-spots, and transit reliability issues. The graphic should make it obvious which modes are currently prioritized and how a proposed alternative (such as adding bus lanes and safer crossings) would redistribute space and benefits.
Designer prompt: “Layered diagram of an urban transportation corridor showing multimodal demand, safety hot-spots, and proposed improvements such as bus lanes, protected bike lanes, and enhanced crossings, annotated with planning metrics like person throughput and access to key destinations.”
Relevant standards and design references
Transportation planning decisions must ultimately be compatible with the standards and manuals that govern detailed design and operations. While planners often work at a conceptual level, referencing the right documents early helps ensure that recommended projects can be designed and built without major rework.
- AASHTO “Green Book” (A Policy on Geometric Design of Highways and Streets): Provides guidance on cross-sections, horizontal and vertical alignment, sight distance, and other geometric elements. Planners use it to confirm that proposed cross-sections and design speeds are geometrically feasible.
- Highway Capacity Manual (HCM): Defines methods for estimating capacity, level of service, delay, and queueing for a wide range of facilities. Planning-level analyses often use simplified HCM procedures to compare alternatives before detailed design.
- Manual on Uniform Traffic Control Devices (MUTCD): Governs signs, signals, markings, and other traffic control devices. Corridor plans that propose new signalization, roundabouts, or lane-use controls must align with MUTCD principles so that design and operations teams can implement them.
- Transit agency and state DOT design manuals: Many agencies publish their own roadway, transit, and bicycle design guides that supplement national standards. Planners should consult these documents to understand preferred cross-section templates, design speeds, and multimodal design expectations.
Frequently asked questions
Transportation planning focuses on the long-term strategy of how a network should evolve, which projects to build, and how different modes should be prioritized across a city or region. Traffic engineering focuses on detailed facility-level decisions such as lane configurations, signal timing, and signing and striping. Planners set direction and choose preferred alternatives, while traffic engineers translate those choices into designs that meet standards and operate safely.
You should be comfortable with algebra, basic statistics, and introductory calculus, since many planning tasks involve working with growth rates, distributions, and performance metrics. Familiarity with regression, probability, and matrix concepts helps when interpreting travel demand models and scenario analyses. Most early-career planning work relies more on clear thinking and careful data handling than on highly advanced mathematics, but stronger math skills open the door to more technical modeling roles.
Transportation planners commonly work for city and county public works departments, metropolitan planning organizations (MPOs), state departments of transportation, and transit agencies. Many others work in consulting firms that prepare corridor studies, long-range plans, and environmental documents for these public clients. Some roles are policy-focused, while others are more technical and closely integrated with engineering and modeling teams.
Summary and next steps
Transportation planning is where engineering, policy, land use, and community values converge. A good plan clearly defines problems, uses data and models appropriately, and recommends projects that are both technically feasible and aligned with broader goals such as safety, reliability, equity, and sustainability. As a transportation engineer or student, understanding this process helps you see how individual drawings and calculations fit into the bigger picture of how a network evolves over decades.
The most effective planners are those who can move comfortably between scales: they understand regional travel patterns and funding constraints, but they also have enough engineering knowledge to recognize when a proposed cross-section, intersection treatment, or transit configuration is realistic. They are skeptical but open-minded about models, validate results with observed data, and communicate tradeoffs clearly to decision-makers and the public.
As you deepen your expertise, focus on building both technical and communication skills. Learn the core standards and analysis methods, but also practice explaining complex tradeoffs in plain language. That combination is what allows transportation planners and engineers to move projects from concept to construction while maintaining safety, reliability, and public trust.
Where to go next
Continue your learning path with these curated next steps.
-
Explore the Transportation Engineering hub
See how planning fits alongside traffic engineering, geometric design, safety, and other core transportation topics.
-
See design examples that grow out of transportation plans
Walk through step-by-step examples showing how corridor studies translate into detailed geometric and traffic designs.
-
Practice with related calculators on Turn2Engineering
Apply planning concepts by testing volumes, speeds, capacity, and safety metrics with interactive engineering calculators.
Work with real numbers
Engineering calculators & equation hub
Jump from theory to practice with interactive calculators and equation summaries covering civil, mechanical, electrical, and transportation topics.