Key Takeaways
- Phasing is the “who goes with who” plan (movement groupings and sequence); timing is “how many seconds” each phase gets.
- First-pass timing usually comes from lane-group demand, saturation flow, lost time, and minimum pedestrian requirements—not from guessing.
- Most design is iterative: compute a plan, then check v/c, delay, and queue storage and adjust splits, cycle, or even the phase plan.
- A timing plan that “works on paper” can still fail in the field if it ignores offsets/coordination, heavy turning peaking, or short turn-bay storage.
Table of Contents
Featured diagram
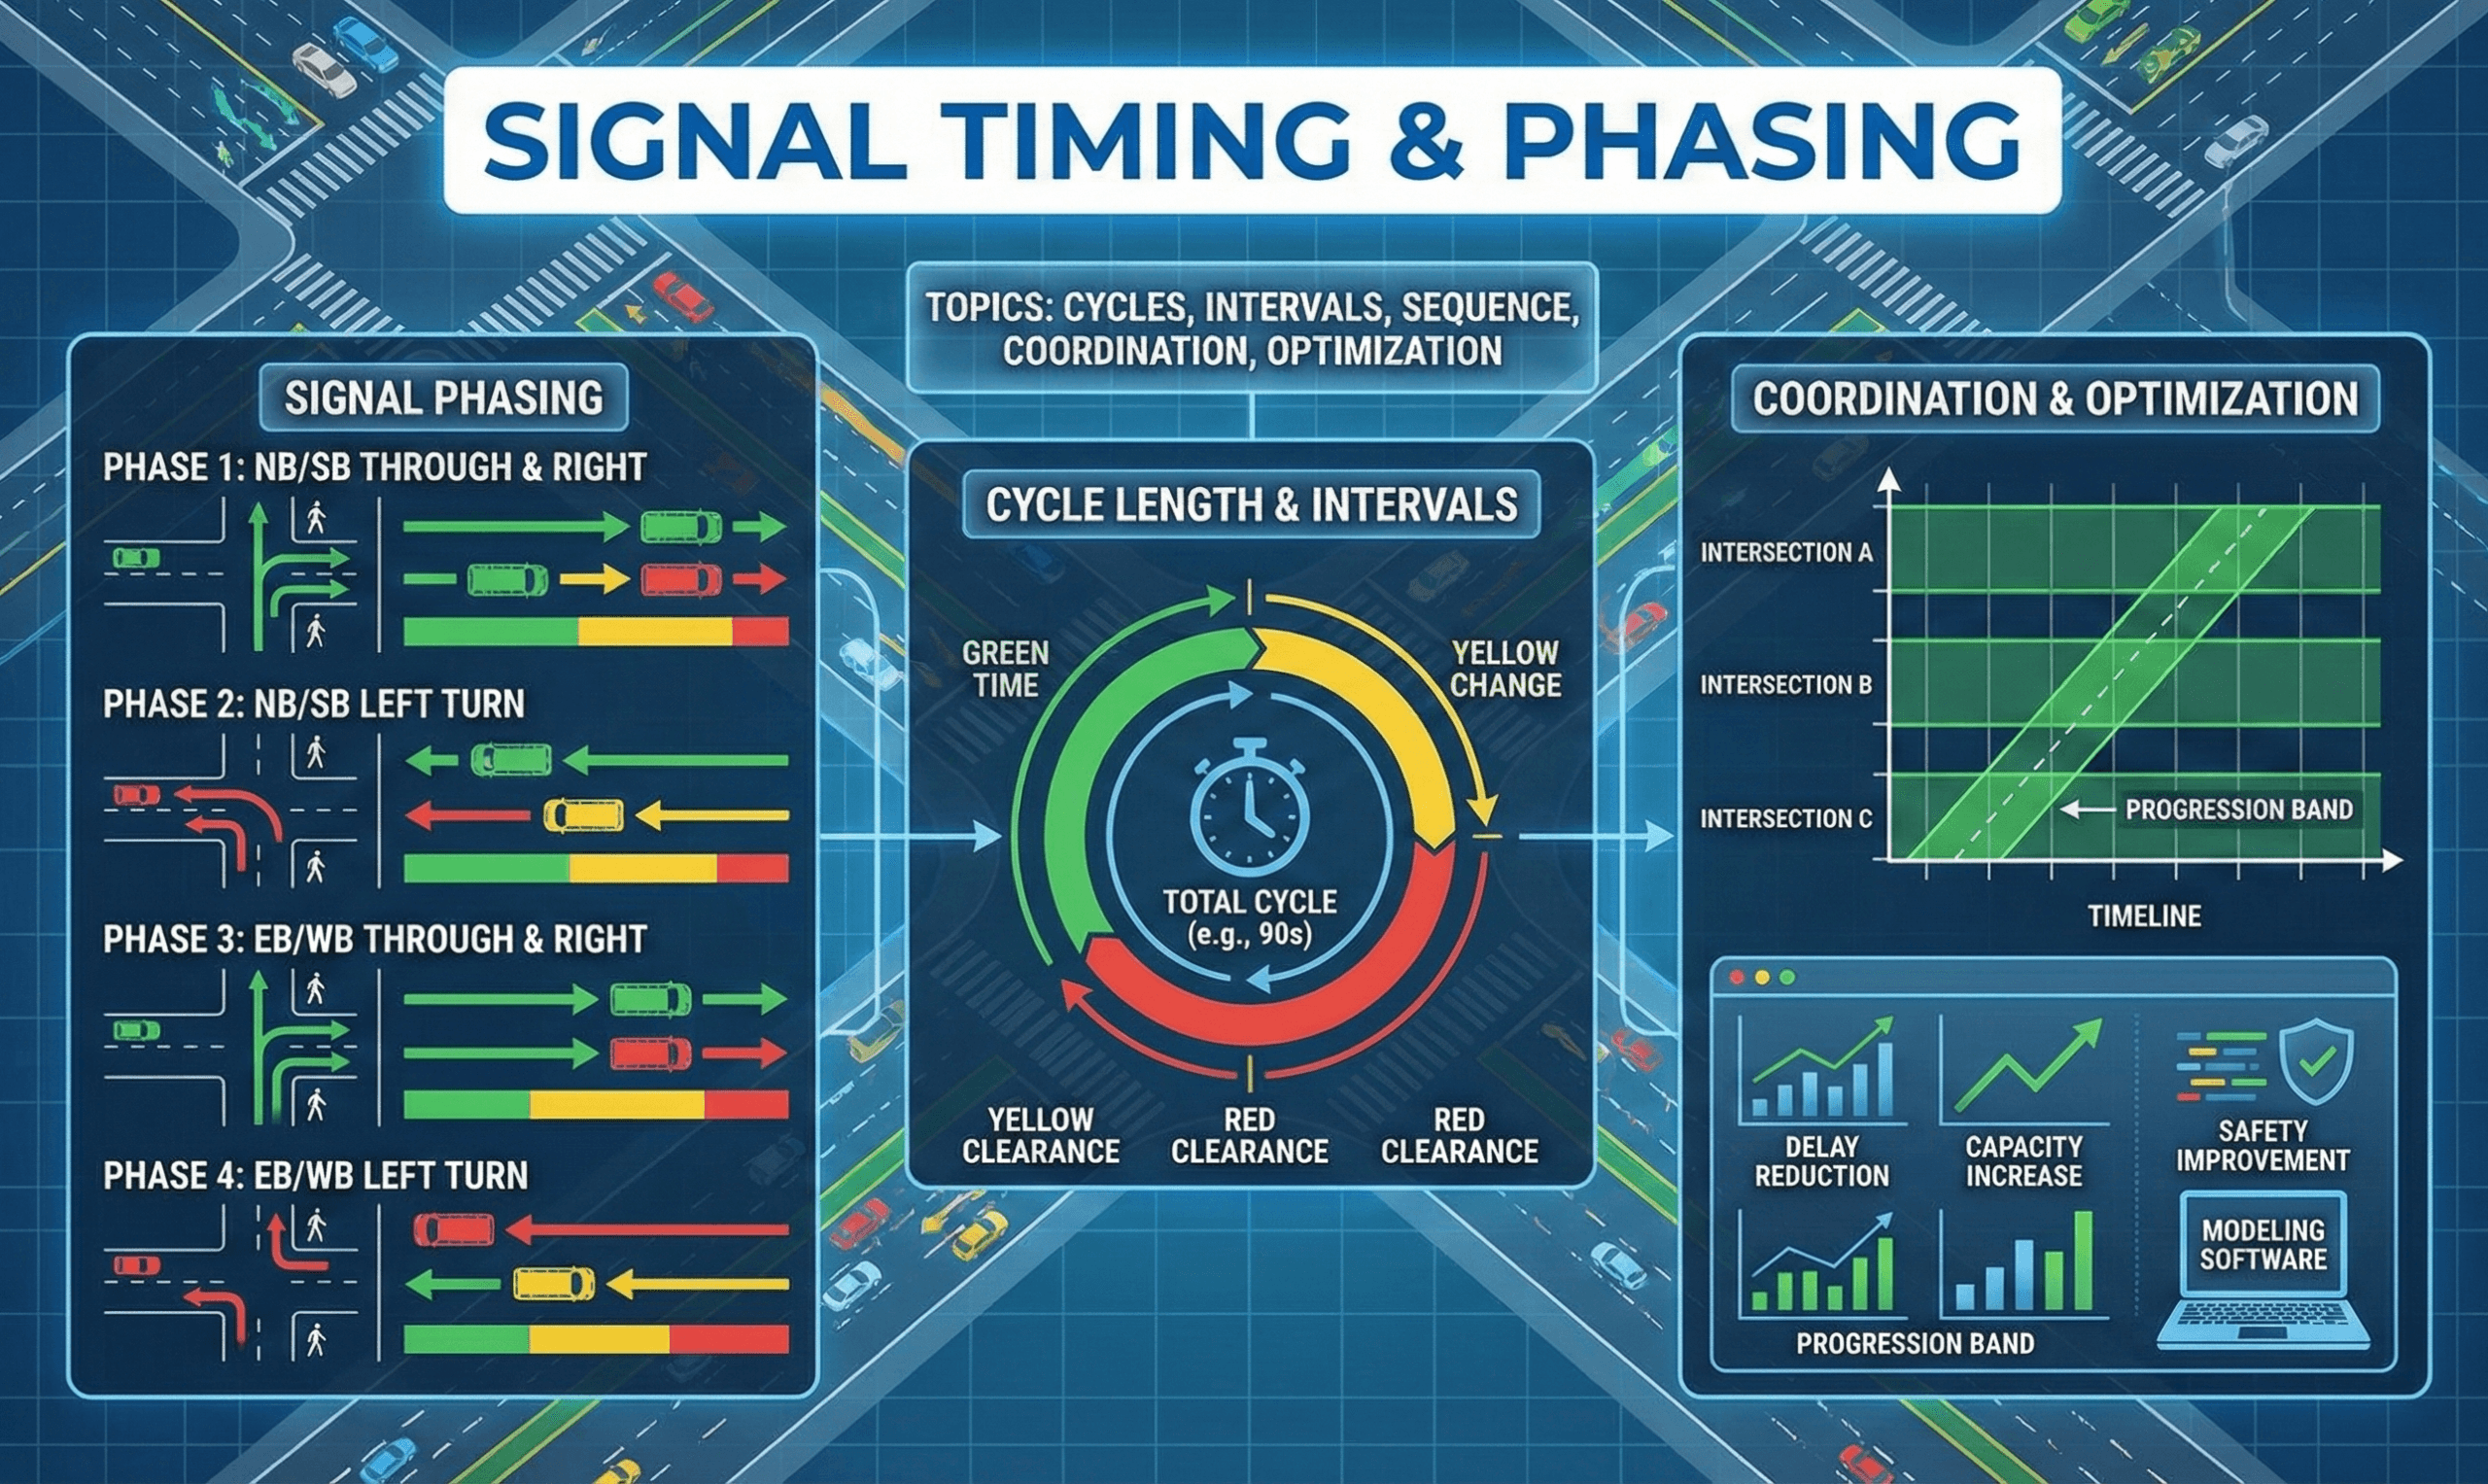
Quick note: This page focuses on the engineer’s start-to-finish workflow for building a usable first-pass timing plan and then validating it with capacity and queue checks.
Introduction
Signal Timing and Phasing is the practical craft of taking real movements (through, left, right, pedestrian crossings) and organizing them into a safe sequence (phasing), then allocating seconds to each part of that sequence (timing). If you’ve ever asked “Why does my movement wait so long?” or “Why do queues spill back into the upstream intersection?”, the answer is almost always buried in phase selection, lost time, green splits, storage constraints, and coordination decisions. This guide walks through the full process an engineer uses to build a timing plan from scratch—starting with movement data and geometry, building a phase plan, estimating saturation flow and lost time, choosing a cycle length and splits, then running the checks that catch problems before they show up in the field.
What is Signal Timing and Phasing?
Phasing is the plan for which movements run together and in what order. It answers questions like: Do opposing left turns run protected at the same time? Do pedestrians run concurrently with parallel through traffic? Are right turns permissive during pedestrian walk, or restricted?
Timing is the assignment of seconds to each phase and to clearance intervals. It includes the cycle length, green splits, yellow change, all-red, pedestrian walk and flashing don’t-walk, and any minimum or maximum constraints (especially for actuated operation).
If you feel “stuck,” separate the problem: first confirm the phase plan (compatibility and safety), then tune timing (seconds) to meet performance targets like v/c, delay, and queue storage.
Inputs you need before you start
A solid first-pass plan does not require simulation, but it does require the right inputs. Collect these before you attempt calculations:
- Turning movement volumes (veh/h) by approach and by time period (AM peak, PM peak, etc.).
- Lane geometry: lane counts by movement, exclusive turn lanes, storage lengths, taper lengths, and any lane-use controls.
- Heavy vehicle percentage, grade, and area type assumptions (these affect saturation flow and discharge).
- Pedestrian crossings: crosswalk length and any minimum walk/clearance requirements.
- Existing constraints: nearby railroad preemption, transit priority, school timing, driveway queues, or corridor coordination needs.
Using only approach AADT (or daily counts) to “time” a signal is a fast way to build a plan that fails at peak. Timing design is driven by peak-hour movement demand and lane-group service.
Define movements, lane groups, and conflicts
The building blocks of signal analysis are movements and lane groups. A movement is a specific direction of travel (e.g., eastbound left). A lane group is the set of one or more lanes that serve one or more movements together (e.g., two through lanes plus a shared through-right lane).
Step 1: map the movement set
List every vehicle movement and pedestrian crossing that must be served. Include special movements like U-turns (if allowed), slip lanes, and channelized right turns. Then identify which movements are compatible (can run together without unsafe conflicts).
Step 2: define lane groups the way the field behaves
If one lane is shared (through-right), it may become the critical lane group even when through demand is moderate—because right-turn demand steals green from through discharge. Build lane groups based on shared usage and storage constraints, not just striping.
Verify your lane groups match what queues actually do: if a right-turn queue blocks through, treat it as a lane-group problem (shared lane or inadequate storage), not just a “timing” problem.
Build a phase plan that matches the intersection
Phasing starts as a safety-and-compatibility problem. Your goal is to serve every required movement with a sequence that is understandable, minimizes risky conflicts, and fits the geometry.
Common phase plan patterns
- Two-phase (simple): major street throughs and minor street throughs (lefts permissive, low turning volumes).
- Protected-permissive left (PPLT): lefts get a protected interval plus permissive during opposing through green (requires good sight distance and manageable opposing flow).
- Protected-only left: lefts run only with a protected arrow (common with high opposing flow, poor sight distance, or crash history).
- Split phasing: opposing approaches do not run simultaneously (used when left-turn conflicts are severe or geometrics require it).
- Lead/lag lefts: the left arrow can occur before (lead) or after (lag) the opposing through phase; coordination and queue patterns often drive the choice.
Pedestrian accommodation in the phase plan
Pedestrian service is typically concurrent with parallel vehicle greens, but the crosswalk length and pedestrian speed assumptions set a minimum time requirement that can control your split decisions—especially on short cycles.
If a movement needs protection (left turns, school crossings, unusual geometry), decide that early. Trying to “fix” a fundamentally unsafe permissive movement using only timing usually backfires.
Translate demand into capacity: the lane-group basics
Once you have lane groups and a phase plan, you can relate demand to service. A widely used first-pass relationship is that a lane group’s capacity scales with its saturation flow and the fraction of the cycle it receives effective green.
This equation is intentionally simple, but it’s powerful: it shows why short greens can “starve” a lane group even if the cycle length looks reasonable. Here, effective green \(g\) excludes lost time (startup and clearance) that does not serve vehicles.
- \(c\) Movement capacity (veh/h for the lane group)
- \(s\) Saturation flow rate (veh/h of green, typically per lane or lane group)
- \(g\) Effective green time for the movement (s)
- \(C\) Cycle length (s)
If a lane group is failing, ask “Is \(g/C\) too small?” before you assume the only fix is a longer cycle. Sometimes the right fix is reallocating green or adjusting the phase plan so the critical lane group isn’t competing with a shared-lane movement.
Account for lost time and clearance intervals
Not all time in the cycle serves vehicles. Two big categories reduce effective green: startup lost time (drivers react and accelerate at the start of green) and clearance time (yellow and all-red) that clears the intersection.
Yellow and all-red are safety-critical, not “tuning knobs”
Change interval design is typically governed by agency policy and engineering judgment tied to speed environment, perception-reaction assumptions, and intersection width. Treat these as constraints: you generally pick them, document them, and then design splits and cycle around them.
Why lost time pushes cycles longer
If you run many phases with short greens, the fraction of the cycle consumed by lost time increases, which reduces \(g/C\) for everyone. This is one reason complex phasing often needs either longer cycles or fewer phase changes.
“Fixing” poor progression by shaving clearance intervals is risky. If you need more usable green, adjust splits, cycle length, or coordination first—and follow agency change-interval policy.
Build the timing plan step-by-step
Below is a practical start-to-finish workflow for building a first-pass plan you can defend. You can apply it to isolated signals or as the starting point for coordinated corridors.
1) Choose the analysis period and build demand by lane group
Pick the peak period you are timing for (e.g., PM peak). Convert turning movement counts into lane-group demand \(v\) (veh/h). If a lane is shared, apportion the demand to the lane group that shares discharge.
2) Estimate saturation flow \(s\) for each lane group
Saturation flow represents how many vehicles can discharge per hour of green under near-ideal conditions. Start from a base assumption (often per lane) and apply adjustments for heavy vehicles, grade, lane width, turn radius, parking friction, and area type as needed.
3) Compute flow ratios and identify critical lane groups
A common planning concept is the “critical” lane group in each phase (the one that drives how much green that phase needs). Even if you don’t compute full delay, identifying the critical lane group prevents you from over-serving low-demand movements.
4) Select a starting cycle length \(C\)
Choose a cycle length consistent with the phase plan complexity, pedestrian constraints, and (if applicable) corridor coordination. In coordinated corridors, cycle length is often set by progression needs, then splits are designed within that cycle.
5) Allocate green splits (effective green \(g\))
Allocate more effective green to phases with higher critical demand relative to capacity needs. After assigning splits, convert effective green to displayed green by adding back the lost-time assumptions and verifying minimum greens.
6) Add pedestrian minimums and verify compliance
For each crosswalk, ensure the pedestrian timing (walk + clearance) fits within the concurrent vehicle phase. If the minimum ped time is larger than what the vehicle split would otherwise be, it becomes a controlling constraint.
7) Run checks: v/c, delay reasonableness, and queue storage
Use \(c = s(g/C)\) to compute lane-group capacities and approximate v/c. Then check whether queues fit within available storage (especially turn bays) and whether spillback would block upstream operations.
8) Iterate (this is where real designs are made)
If v/c is high for a lane group, you can reallocate splits, adjust cycle length, change phase sequence (lead/lag), or change the phase plan (e.g., protected-only left). Timing is not one-and-done; it’s an engineered compromise based on observed constraints.
When you iterate, change one lever at a time and re-check storage. A plan that reduces delay but causes left-turn spillback into a through lane is usually a net loss in the field.
Worked example: first-pass green split and capacity check
This example shows the mechanics of using \(c = s(g/C)\) for a quick first-pass check. Assume an isolated signal with a chosen cycle length \(C = 100\) s and two key phases: major street through (Phase A) and minor street through (Phase B). Clearance intervals and startup losses have already been accounted for, and you estimate effective greens \(g_A = 55\) s and \(g_B = 25\) s for the two phases (the remaining time is lost time across phases).
Example
Suppose the major street through lane group has \(s_A = 3{,}600\) veh/h of green (two lanes combined) and the minor street lane group has \(s_B = 1{,}800\) veh/h of green (one lane). Compute capacities:
If observed demands are \(v_A = 1{,}700\) veh/h and \(v_B = 520\) veh/h, then major street is under capacity (\(v/c \approx 0.86\)) while minor street is over capacity (\(v/c \approx 1.16\)). A first-pass fix is to shift effective green from Phase A to Phase B (if feasible), or reconsider phase needs (e.g., permissive vs protected operations) and storage constraints.
If a minor-street movement is over capacity, increasing cycle length without changing splits may not help much—because \(g/C\) can stay nearly the same. You typically need a higher fraction of the cycle (more effective green), reduced demand, or more lanes/storage.
Queue storage checks that prevent “field failures”
Capacity alone doesn’t guarantee a plan will work. Many real-world timing failures are storage failures: turn-bay queues exceed available storage and spill back, blocking adjacent through lanes or upstream intersections. Always check storage for:
- Exclusive turn bays (left and right): do queues exceed bay length during peaks?
- Shared lanes: does right-turn queuing block through discharge?
- Downstream congestion: will a downstream queue block your discharge even with green?
- Pedestrian spillover: heavy pedestrian platoons can reduce turning discharge in permissive situations.
| Check | What to compare | Why it matters | Typical fix if it fails |
|---|---|---|---|
| Turn-bay storage | 95th percentile queue vs bay length | Prevents spillback into through lanes | More split, longer bay, revised phasing |
| Shared-lane blockage | Right-turn queue vs shared lane capacity | Steals green from through movement | Channelize, add lane, restrict turns |
| Downstream blocking | Available downstream storage vs discharge | Green time can be wasted if blocked | Coordination, metering, network fix |
| Ped minimums | Ped timing vs vehicle split | Can force longer splits or cycles | Adjust cycle/splits, refuge design |
Declaring success because v/c looks “okay” while ignoring a short left-turn bay is one of the most common ways to create a plan that looks fine in analysis but fails every weekday at 5 PM.
Actuated operation and coordination basics
Many modern signals are actuated: detectors (or video/radar) let phases extend when vehicles are present and gap out when demand is low. In actuated timing, you still design a base plan—minimum greens, maximum greens, pedestrian timings, and coordination constraints—then the controller allocates seconds dynamically.
Key actuated timing terms you must set
- Minimum green: the guaranteed service when a phase is called.
- Vehicle extension / passage time: how long the green is extended when vehicles are detected.
- Maximum green: the cap to prevent one phase from starving others.
- Gap out / max out: how the controller decides to end a phase (no demand vs reaching max).
Coordination: cycle and offset become design constraints
On corridors, coordination aims to create progression bands so platoons arrive on green. In that case, cycle length and offsets are often set corridor-wide, and each intersection’s splits are tuned within that fixed framework. If progression is the goal, you must evaluate how your splits affect both queueing and platoon release.
If you’re on a coordinated corridor, confirm your chosen cycle length is compatible with neighbors. A great isolated plan can be a poor corridor plan if it destroys progression and creates mid-block queue spillback.
Work with real numbers
Engineering calculators & equation hub
Jump from theory to practice with interactive calculators and equation summaries covering civil, mechanical, electrical, and transportation topics.
Visualizing a complete timing plan
A helpful way to “see” timing is to sketch a time-space style bar chart for one full cycle: stack each phase’s green, yellow, and all-red in sequence, and annotate which movements are served. Then add a second row for pedestrians to confirm each crossing’s walk and clearance fits inside the concurrent phase. If you can’t explain the plan with one clear cycle diagram, most users (and many field technicians) will struggle to implement and troubleshoot it.
(Optional future figure idea) Create a single-cycle chart that labels: Phase A/B/etc., \(g\), yellow, all-red, total \(C\), and the served movements per phase.
Relevant standards and design references
Signal timing and phasing is typically designed and evaluated using a combination of national guidance, agency policy, and operational analysis methods. These are the references you’ll see most often in real projects:
- Highway Capacity Manual (HCM): Common framework for lane-group analysis, capacity, delay, and level of service at signalized intersections.
- MUTCD: Governs signal indications and many operational requirements that affect what phasing is allowed and how it is displayed to road users.
- AASHTO Green Book: Geometric design context (speeds, sight distance, alignment) that often influences whether permissive turns are appropriate.
- FHWA Signal Timing Manual: Practical guidance on building, implementing, and maintaining timing plans, including process and data needs.
- Local agency signal timing policies: Change interval policies, ped assumptions, coordination standards, and documentation requirements vary by jurisdiction.
Frequently asked questions
Phasing defines the movement groupings and the order they run (compatibility and sequence), while timing assigns seconds to each phase and clearance interval (cycle length, greens, yellow, all-red, and ped timing). You can often improve performance with timing changes alone, but safety or geometry issues usually require a phasing change.
Cycle length is chosen to balance lost time, delay, pedestrian needs, and coordination requirements: short cycles reduce red time but can waste a higher fraction on lost time, while longer cycles reduce the lost-time fraction but can increase waiting and queues if splits are not tuned. Engineers typically pick a defensible starting cycle and then iterate using v/c, queue storage, and (when applicable) progression goals.
You need peak turning movement volumes, lane geometry (including storage), a reasonable saturation flow estimate, and pedestrian crossing lengths and assumptions. You also need baseline clearance intervals (yellow/all-red) and to know whether the intersection is isolated or coordinated with nearby signals.
Yes—many intersections run multiple time-of-day plans to match demand patterns like AM peak, midday, PM peak, and off-peak. The same phasing can be retimed with different cycle lengths and splits, or the intersection may switch to different phasing (for example, protected-only lefts during a peak period).
Summary and next steps
Signal Timing and Phasing is a structured engineering process: define movements and lane groups, choose a phase plan that safely serves those movements, then allocate time in a way that matches demand, respects pedestrian and clearance constraints, and avoids storage failures. The core idea is simple—capacity scales with saturation flow and effective green—but the craft is in choosing a plan that works in the real intersection: shared lanes, short bays, peaking turns, corridor coordination, and local policies.
If you’re building a first-pass plan, focus on getting the fundamentals right: lane-group demand, realistic saturation flow, defensible lost-time assumptions, and a cycle/split set that passes v/c and queue checks. Then iterate—because almost every good timing plan is an improved version of a reasonable starting point, refined with targeted adjustments and field reality in mind.
Where to go next
Continue your learning path with these next steps in Transportation Engineering.
-
Traffic Flow Theory
Build intuition for how demand, capacity, and congestion form—useful when you evaluate intersection operations, queue growth, and spillback risk.
-
Intersection Design
See how geometry, lane groups, storage, and control selection shape what timing and phasing options are feasible.
-
Transportation Engineering Hub
Browse additional transportation resources and guides that connect operations, safety, and design workflows.
Work with real numbers
Engineering calculators & equation hub
Jump from theory to practice with interactive calculators and equation summaries covering civil, mechanical, electrical, and transportation topics.