Key Takeaways
- Core idea: Geometric design of roads determines the physical shape of a roadway so it is safe, predictable, comfortable, and appropriate for its intended users.
- Engineering use: Engineers use geometric design to size curves, grades, sight lines, lane widths, shoulders, cross slopes, intersections, and roadside recovery areas.
- What controls it: The biggest controls are design speed, operating speed, design vehicle, terrain, traffic mix, roadway context, sight-distance requirements, and agency criteria.
- Practical check: A roadway can meet one equation and still perform poorly if horizontal alignment, vertical profile, cross section, drainage, and roadside safety are not checked together.
Table of Contents
Introduction
Geometric design of roads is the process of selecting a roadway’s physical shape, including horizontal alignment, vertical profile, lane and shoulder widths, cross slopes, sight distance, and roadside clearances. Engineers use design speed, design vehicle, terrain, traffic conditions, and safety criteria to create roads that are safe, predictable, and comfortable to drive.
This topic is central to transportation engineering because it connects a road’s intended function to the way drivers, trucks, cyclists, pedestrians, and other users experience the facility in the field. A curve that feels too sharp, a hillcrest that limits visibility, or a narrow shoulder next to a steep slope are all geometric design issues.
Geometric Road Design Diagram
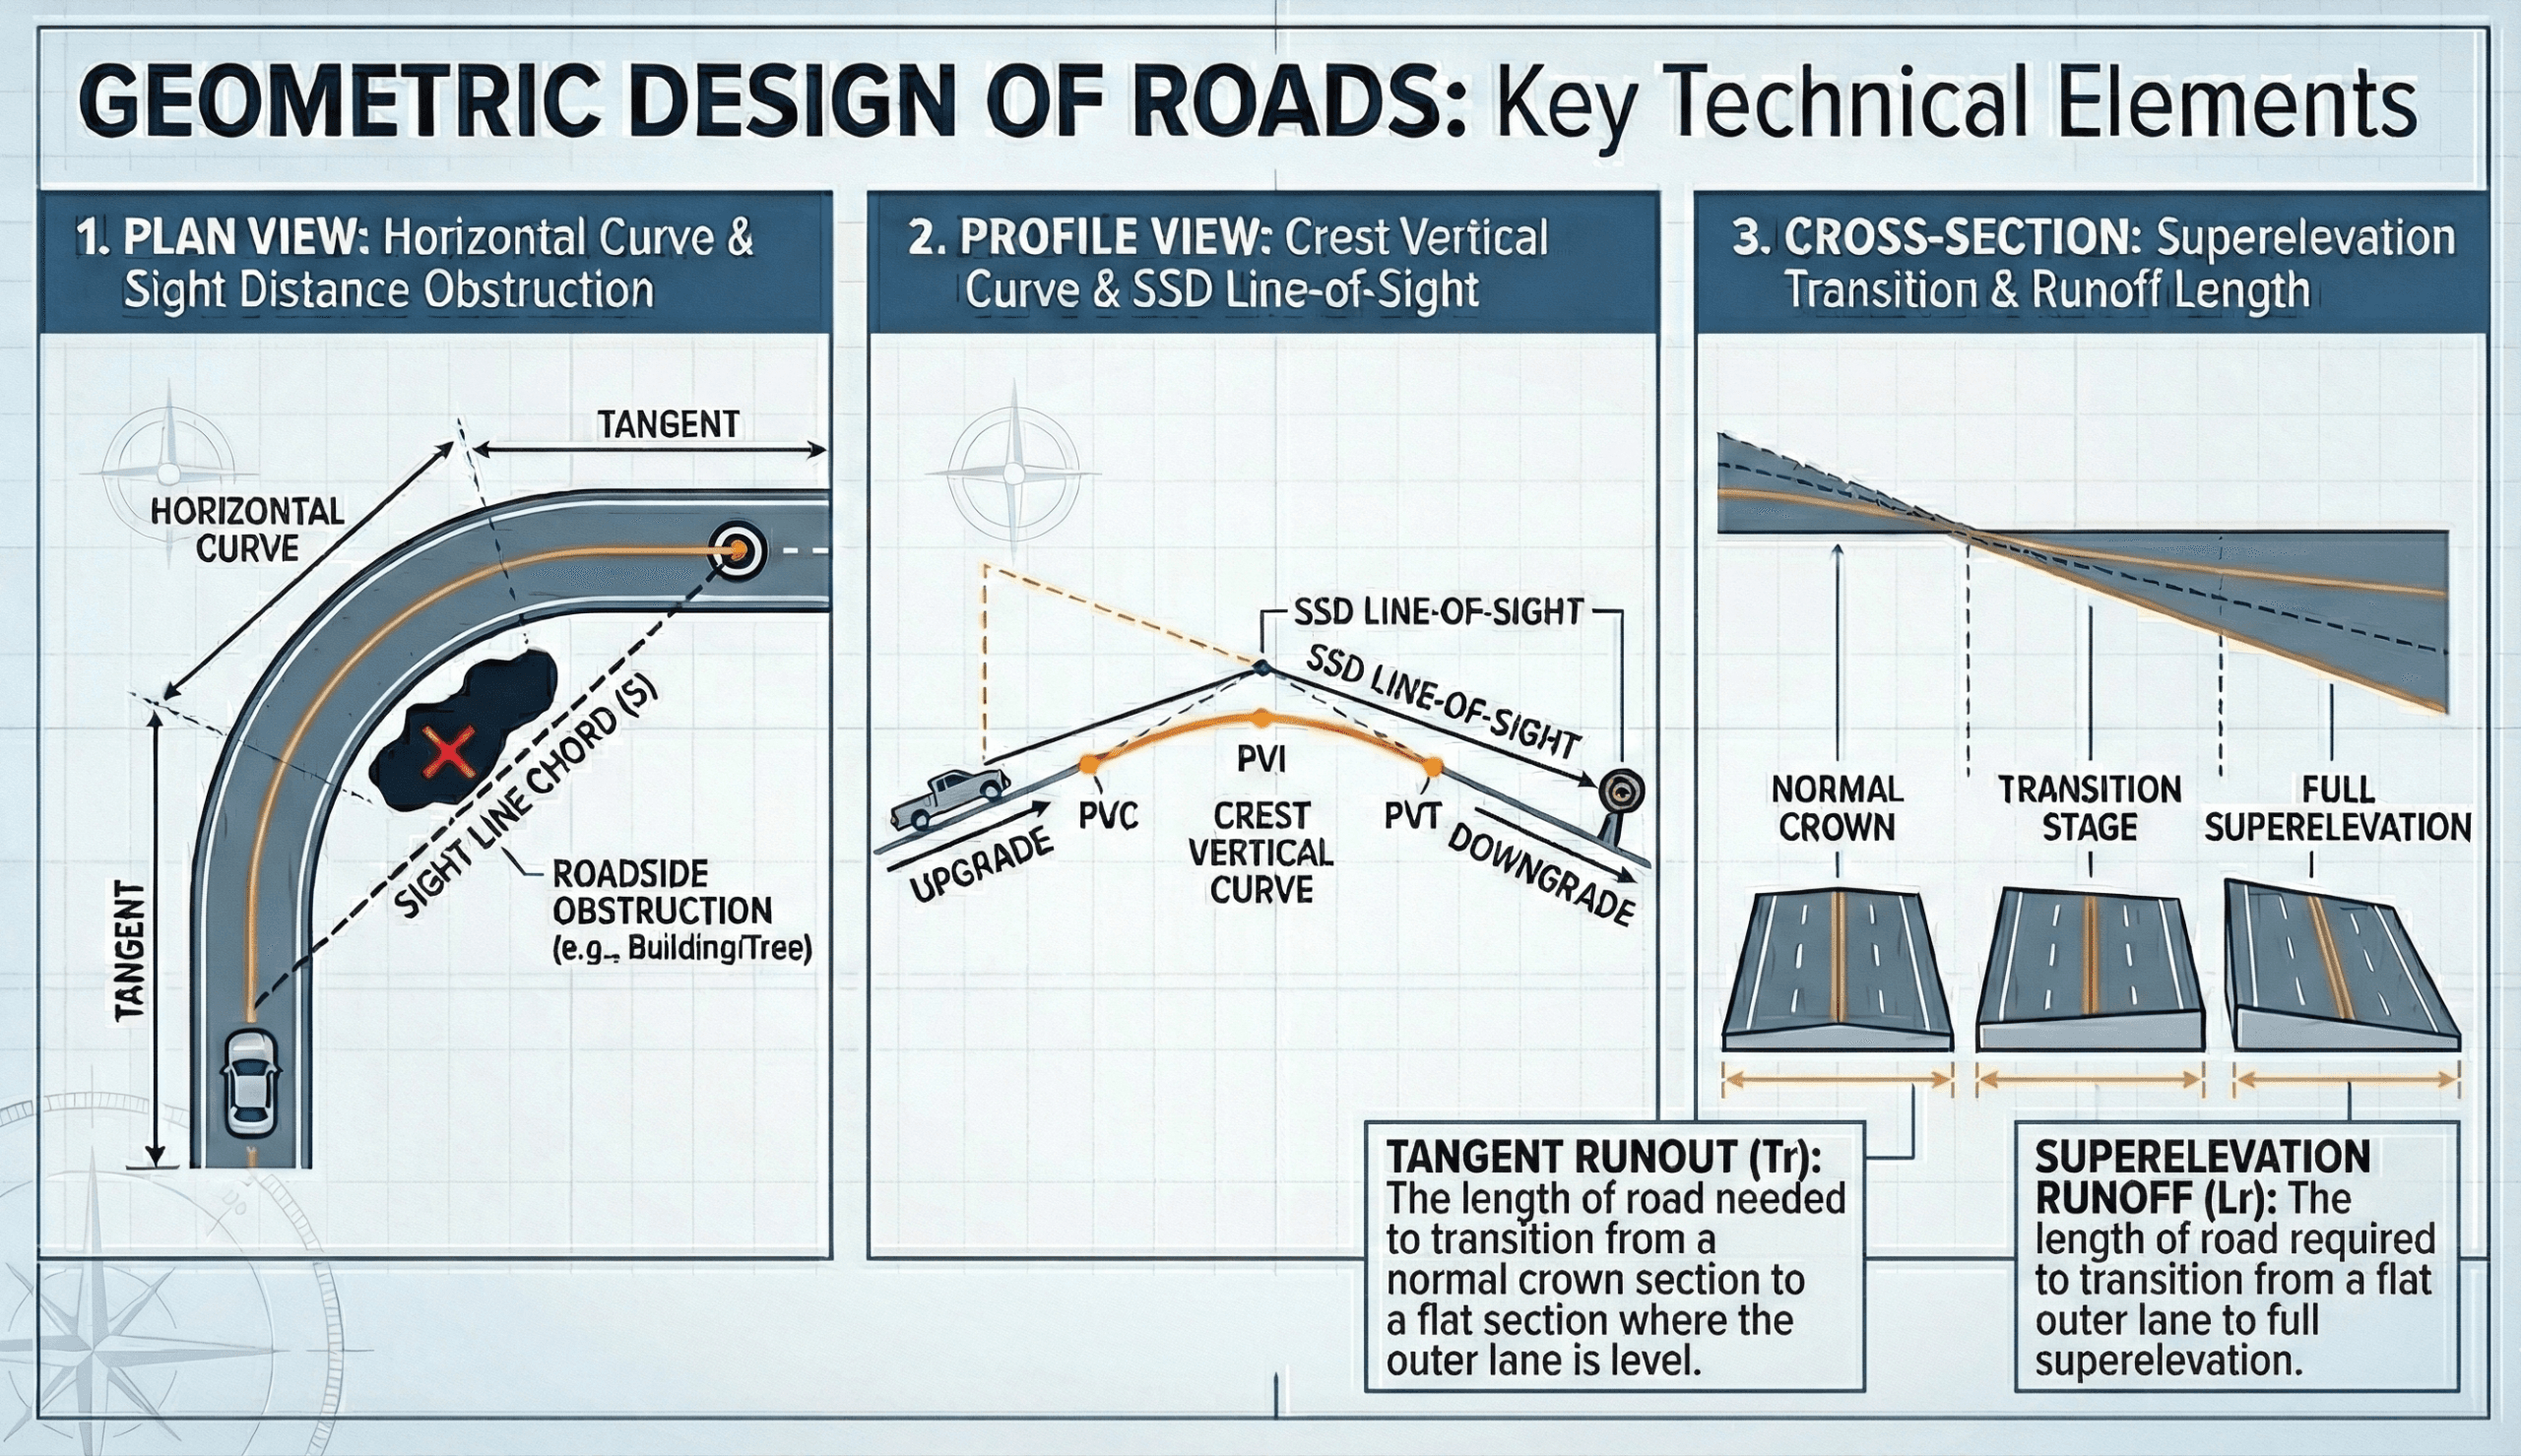
The key idea is that the roadway must work as a system. A design that looks acceptable in plan view can still fail if the profile limits sight distance, the cross slope creates drainage problems, or a roadside obstruction blocks the driver’s line of sight.
What is Geometric Design of Roads?
Geometric design of roads is the engineering process of defining the visible and physical layout of a roadway. It includes the path of the road in plan view, the rise and fall of the profile, the width and slope of the cross section, and the sight lines available to drivers. The goal is to create a road that supports safe vehicle movement, predictable driver behavior, effective drainage, and appropriate roadside recovery.
A shallow definition might say geometric design is simply “road layout.” In practice, it is more than that. Geometric design is the link between driver expectation and roadway form. If the road visually encourages high speeds but contains a tight curve, hidden driveway, steep downgrade, or limited sight distance, the geometry can create a safety problem even if individual dimensions appear reasonable.
Good geometric design is not just about meeting minimum values. It is about creating consistent geometry that gives users enough time, space, and visual information to react safely.
Main Elements of Geometric Road Design
Roadway geometry is made of several elements that must work together. If one element is changed, the others may need to be rechecked. For example, increasing design speed affects stopping sight distance, curve radius, vertical curve length, superelevation, and roadside safety needs.
| Element | What it controls | Typical design question |
|---|---|---|
| Horizontal alignment | The plan-view path of the roadway | Are curves large enough for the selected speed and context? |
| Vertical alignment | Grades, crest curves, and sag curves | Can drivers see far enough over crests and through sags? |
| Cross section | Lanes, shoulders, medians, side slopes, and roadside area | Does the roadway provide enough operating width, drainage, and recovery space? |
| Sight distance | The visible roadway length available to drivers | Can drivers see, react, stop, or maneuver in time? |
| Superelevation | The banking of the roadway on curves | Does the curve geometry reduce lateral demand without creating drainage or comfort problems? |
| Intersections and access | Turning paths, conflict points, and sight triangles | Can vehicles enter, cross, or turn safely? |
| Roadside safety | Clear zones, barriers, slopes, and fixed objects | What happens if a vehicle leaves the travel lane? |
These elements should not be designed in isolation. A horizontal curve may meet minimum radius criteria but still fail if a barrier, wall, vegetation, or cut slope blocks the required sight line.
Design Controls Used in Geometric Design
Design controls are the project inputs that govern most geometric decisions. Establishing them early prevents rework and makes later design reviews easier. If design speed, design vehicle, or roadway context changes late in the process, horizontal curves, vertical curves, intersections, shoulders, and sight-distance checks may all need to be revised.
Core design controls
- Functional classification: local street, collector, arterial, freeway, rural road, or other roadway class.
- Design speed: the speed used to select geometric criteria such as curve radius and sight distance.
- Operating speed: the speed drivers are expected to actually travel under real conditions.
- Design vehicle: the vehicle used to check turning paths, lane widening, intersection geometry, and offtracking.
- Terrain: level, rolling, or mountainous conditions that influence grades, earthwork, and vertical alignment.
- Traffic mix: passenger vehicles, trucks, buses, emergency vehicles, bicycles, and pedestrians.
- Roadway context: rural, suburban, urban, constrained, high-speed, low-speed, multimodal, or access-controlled.
- Project constraints: right-of-way, utilities, drainage outlets, structures, environmental limits, access points, and adjacent development.
- V Design speed, usually in mph or km/h.
- DV Design vehicle used for turning and swept-path checks.
- e Superelevation rate, expressed as ft/ft, m/m, or percent.
- f Side friction factor used in horizontal curve design.
- G Roadway grade, expressed as a decimal or percent depending on the formula.
- SSD Stopping sight distance, the distance needed to perceive, react, and stop.
Design speed vs. operating speed
Design speed is the speed used to select geometric criteria. Operating speed is the speed drivers are likely to choose in the field. These values should be consistent. A road that visually feels fast but contains low-speed geometry can create sudden driver workload and higher safety risk.
Do not begin detailed horizontal and vertical alignment before confirming the design speed and design vehicle. These two decisions control many later checks.
Sight Distance in Geometric Design
Sight distance is the length of roadway visible to a driver. It is one of the most important safety checks in geometric design because it determines whether drivers have enough distance to detect a condition, react, stop, or make a safe maneuver.
Types of sight distance
- Stopping sight distance: distance needed to see a hazard and stop before reaching it.
- Decision sight distance: longer distance used where drivers must detect, understand, decide, and maneuver.
- Intersection sight distance: sight distance needed at driveways, side roads, and intersections.
- Passing sight distance: distance needed for passing maneuvers on two-lane roads where passing is permitted.
Stopping sight distance equation
A common US customary planning-level equation for stopping sight distance is:
The first term estimates perception-reaction distance. The second term estimates braking distance. The grade sign depends on the adopted convention and travel direction. Downgrades increase stopping distance, while upgrades reduce it.
- SSD Stopping sight distance, typically in feet for this equation.
- V Design or check speed, mph.
- t Perception-reaction time, commonly 2.5 seconds for design checks.
- f_b Braking friction factor from governing design criteria.
- G Grade as a decimal, such as 0.04 for 4%.
Intersection sight distance
Intersection sight distance is especially important on real roadway projects. A mainline road may meet stopping sight distance, but a driveway or side-street driver may still have limited visibility because of vegetation, walls, parked vehicles, signs, buildings, or roadside grading.
If a road has hidden driveways, complex intersections, lane drops, or unusual decision points, do not rely only on stopping sight distance. Check decision sight distance and intersection sight distance as well.
Horizontal Alignment and Curve Radius
Horizontal alignment is the plan-view path of the roadway. It includes tangents, curves, and sometimes spiral transitions. The key design question is whether a curve is large enough for the selected speed, superelevation, friction, context, and driver expectation.
Minimum horizontal curve radius
A common US customary relationship for horizontal curve radius is:
In this equation, \(R\) is curve radius in feet, \(V\) is speed in mph, \(e\) is superelevation rate, and \(f\) is side friction factor. This relationship is useful for preliminary sizing, but final design should use the governing agency’s adopted values.
Metric horizontal curve equation
In metric units, a common form is:
In the metric equation, \(R\) is in meters and \(V\) is in km/h. Superelevation \(e\) and side friction \(f\) remain dimensionless.
Superelevation and curve comfort
Superelevation is the banking of the roadway through a curve. It helps reduce reliance on tire-pavement friction by tilting the pavement toward the inside of the curve. However, high superelevation can create drainage, constructability, and low-speed comfort issues, especially in constrained urban areas or climates with snow and ice.
For small angles, superelevation can be approximated as the height difference across the rotated width divided by the width.
Sight distance on horizontal curves
Horizontal curves can fail even when radius and superelevation are acceptable. The most common issue is an obstruction on the inside of the curve, such as a retaining wall, cut slope, barrier, sign, bridge rail, or vegetation. Designers must check whether the available sight line is at least as long as the required stopping sight distance.
Avoid designing every curve at the minimum radius. Geometry that depends on maximum superelevation and maximum side friction has less margin for wet pavement, icy conditions, construction tolerance, and real-world speed variation.
Vertical Alignment, Grades, and Vertical Curves
Vertical alignment defines the roadway profile. It includes grades, crest vertical curves, and sag vertical curves. Good vertical alignment balances sight distance, drainage, vehicle performance, earthwork, and driver comfort.
Grade
Grade is the vertical change divided by horizontal distance, usually expressed as a percent:
Steeper grades can affect truck speed, braking distance, drainage, winter operations, and accessibility. Maximum grades are normally controlled by roadway class, terrain, speed, and agency criteria.
Algebraic grade difference
The main input to many vertical curve checks is the algebraic difference between incoming and outgoing grades:
If \(g_1\) and \(g_2\) are expressed in percent, then \(A\) is also expressed in percent. A larger \(A\) usually requires a longer vertical curve.
K-value approach
Many roadway design procedures use the K-value approach:
\(K\) is the horizontal length of vertical curve per 1% algebraic grade difference. Designers usually select \(K\) from a table based on design speed, sight distance, and whether the curve is a crest or sag curve.
Crest and sag curves
Crest curves are often controlled by line of sight over the hill. Sag curves may be controlled by headlight sight distance at night, drainage, comfort, or vertical acceleration. Both should be checked using agency criteria rather than only visual judgment.
Do not size vertical curves for smoothness only. Sight distance often controls crest curves, and headlight sight distance or drainage can control sag curves.
Cross-Section Design and Roadside Recovery
Cross-section design determines the roadway width and roadside shape. It includes lanes, shoulders, medians, curbs, side slopes, ditches, sidewalks, bike facilities, barriers, and clear zones. Even when plan and profile geometry look acceptable, a poor cross section can create drainage issues, discomfort, and higher crash severity.
Lane and shoulder width
Lane and shoulder widths depend on roadway classification, traffic volume, vehicle mix, speed, context, and right-of-way. Wider shoulders can provide recovery area and space for disabled vehicles, but they also affect cost, drainage, and available roadside space.
Cross slope
Cross slope helps drain water from the pavement surface. A simple geometric relationship is:
Here, \(n\) is cross slope, \(\Delta h\) is the height difference across the pavement, and \(w\) is the width. Typical cross slopes are selected from agency standards and adjusted for pavement type, drainage, climate, and accessibility.
Roadside recovery space
A forgiving road gives an errant driver room to recover or reduces the severity of a roadway departure. Roadside design should consider clear zones, side slopes, fixed objects, barriers, ditches, bridge rails, and culvert headwalls.
If right-of-way constraints force narrow shoulders, steep side slopes, or fixed objects near traffic, flag the issue early and coordinate with safety, drainage, utility, and roadway teams.
Intersections, Driveways, and Access Points
Roadway geometry is not limited to the mainline. Intersections, driveways, and access points often control safety because they introduce turning movements, speed changes, sight triangles, and conflict points.
- Sight triangles: verify that vegetation, walls, signs, buildings, parked vehicles, and roadside features do not block the view.
- Turning paths: confirm that the design vehicle can complete turns without unacceptable encroachment.
- Corner radii: balance turning needs with pedestrian crossing distance and speed control.
- Approach grades: avoid excessive grades near stop-controlled approaches where possible.
- Storage length: provide enough space for turn lanes and expected queues where needed.
- Access spacing: avoid frequent access points that conflict with high-speed geometry.
On real projects, driveway spacing and intersection sight distance can control the design as much as curve radius or vertical curve length.
Step-by-Step Roadway Geometry Workflow
Geometric design is an iterative workflow. Engineers start with design controls, create a preliminary layout, check the design, revise it, and document final criteria.
Define the roadway function → select design speed and design vehicle → establish the typical section → lay out horizontal alignment → check curve radius and superelevation → develop vertical alignment → check sight distance → review intersections and access → check drainage and roadside safety → document criteria and exceptions.
| Workflow step | What to look for | Why it matters |
|---|---|---|
| Confirm design controls | Functional class, speed, vehicle, terrain, context | These inputs control nearly every downstream geometry decision. |
| Check horizontal alignment | Curve radius, superelevation, transitions, sight obstructions | Horizontal geometry controls lateral demand and driver comfort. |
| Check vertical alignment | Grades, K-values, crest curves, sag curves | Vertical geometry controls sight distance, drainage, and vehicle performance. |
| Check cross section | Lane width, shoulders, slopes, medians, clear zones | The cross section affects drainage, comfort, and crash severity. |
| Check access and intersections | Sight triangles, turning paths, storage, driveway spacing | Many operational and safety problems occur at conflict points. |
Worked Example: Curve Radius, SSD, and Vertical Curve Length
This example shows how common geometric design checks work together. The values are for educational planning only. Final design should use the governing agency’s adopted friction factors, SSD tables, K-values, and roadway design criteria.
Example assumptions
Assume a two-lane rural roadway with design speed \(V = 55\) mph, superelevation \(e = 0.06\), side friction factor \(f = 0.12\), and a crest vertical curve where grades transition from \(g_1 = +2.0\%\) to \(g_2 = -1.0\%\). For a planning SSD check, use \(t = 2.5\) seconds, \(f_b = 0.35\), and level grade.
1. Minimum horizontal curve radius
The planning minimum radius is approximately 1,120 ft. A larger radius would usually be preferred where feasible because it improves comfort and provides more design margin.
2. Planning stopping sight distance
The planning stopping sight distance is approximately 490 ft. This should be compared with the governing SSD table, and the controlling value should be used.
3. Algebraic grade difference
4. Vertical curve length
If the governing design table gives a crest-curve \(K\)-value for the selected design speed and sight-distance condition, multiply that value by \(A = 3.0\). For example, if \(K = 100\), then \(L = 100(3.0) = 300\) ft.
After selecting curve radius and vertical curve length, verify that barriers, walls, vegetation, bridge rails, cut slopes, or other roadside features do not block the required sight line.
Engineering Judgment and Field Reality
Road geometry rarely fails because one formula was typed incorrectly. It more often fails because design elements interact in ways that were not checked together. A crest curve inside a horizontal curve, a driveway just beyond a vertical curve, or a barrier on the inside of a curve can create a safety issue even when individual design values appear acceptable.
Drivers respond to what the road appears to allow. If the alignment, lane width, roadside openness, and tangent length encourage high speeds, but the sight distance or curve geometry requires lower speeds, the road can feel surprising and unsafe.
When Geometric Design Assumptions Break Down
Simplified roadway design equations are useful for learning and preliminary checks, but they are not substitutes for governing design manuals, field conditions, or professional judgment.
- Mixed unit systems: US customary and metric formulas use different constants.
- Unusual vehicle mix: heavy trucks, buses, farm equipment, or emergency vehicles may control geometry.
- Constrained urban sites: right-of-way, utilities, sidewalks, buildings, and access points can control the final layout.
- Snow, ice, or frequent rain: drainage and friction assumptions may become more critical.
- Complex intersections: decision sight distance and turning paths may control more than mainline geometry.
- Roadside obstructions: walls, barriers, slopes, and vegetation can reduce available sight distance.
Common Mistakes and Practical Checks
The most common mistakes in geometric road design come from treating equations as isolated checks instead of reviewing the road as a complete system.
- Designing to the minimum everywhere: minimum criteria can technically pass but still create uncomfortable or unforgiving geometry.
- Ignoring operating speed: drivers may travel faster than the assumed design condition if the roadway visually encourages it.
- Forgetting intersection sight distance: side-road and driveway visibility can control safety.
- Missing inside-curve obstructions: barriers, walls, vegetation, and cut slopes can block sight lines.
- Overlooking drainage during superelevation transitions: flat spots can create ponding and hydroplaning risk.
- Not checking the design vehicle: trucks and buses may require larger turning paths or additional widening.
Do not assume that meeting the horizontal curve equation means the curve is safe. Sight distance, superelevation transition, roadside clearance, and driver expectation must also be checked.
Roadway Design Standards and References
Geometric design is standards-driven. Use this page to understand the concepts, equations, and workflow, but use governing design manuals and agency criteria for final values.
- AASHTO Green Book: AASHTO design resources are commonly used as a baseline for geometric design criteria in the United States.
- Federal Highway Administration: FHWA speed and geometric design guidance provides useful context for speed concepts, safety, and roadway design decisions.
- State DOT roadway design manuals: State agencies typically define required values for design speed, sight distance, superelevation, friction factors, K-values, typical sections, and design exceptions.
- Project-specific criteria: Owner requirements, local agency standards, environmental constraints, right-of-way, and site conditions may control the final design.
Frequently Asked Questions
Geometric design of roads is the process of selecting the roadway shape and dimensions, including horizontal alignment, vertical profile, cross section, sight distance, superelevation, and roadside clearances so the road operates safely and predictably.
Geometric design controls the road’s physical layout, including curves, grades, widths, slopes, and sight distance. Pavement design controls the pavement layer structure and materials needed to carry traffic loads over time.
No. Minimum curve radius values are safety thresholds, not ideal design targets. Where feasible, engineers use larger radii to improve comfort, reduce reliance on high superelevation and side friction, and provide more margin for real-world driving conditions.
Start with design speed consistency and sight distance. These checks often reveal whether the roadway geometry matches driver expectations. Then review superelevation transitions, vertical curves, cross slopes, intersection sight distance, drainage, and roadside obstructions.
Summary and Next Steps
Geometric design of roads is the engineering process of shaping a roadway so it operates safely, predictably, and comfortably. It includes horizontal alignment, vertical alignment, cross-section design, sight distance, intersections, superelevation, and roadside safety.
The most important takeaway is that geometric elements must be checked together. A curve can meet the radius equation but still fail because of limited sight distance. A vertical curve can feel smooth but still restrict visibility. A cross section can fit within the right-of-way but still create drainage or roadside safety problems.
Where to go next
Continue your learning path with related Turn2Engineering resources.
-
Transportation Engineering
Explore the broader transportation engineering hub, including roadway design, traffic operations, safety, and planning.
-
Highway Design
Learn how geometric design fits into the full roadway design process.
-
Pavement Design
Learn how pavement layers and materials are selected after roadway geometry and traffic conditions are understood.