Key Takeaways
- Core idea: Water quality management connects monitoring data, pollutant sources, standards, treatment decisions, watershed controls, and long-term protection of water resources.
- Engineering use: Engineers use it to support drinking water supply, stormwater control, watershed restoration, permit compliance, ecosystem protection, and treatment planning.
- What controls it: Water use, pollutant loading, flow conditions, sampling timing, land use, treatment capacity, and applicable criteria determine the management approach.
- Practical check: A single lab result rarely tells the full story; engineers look for trends, source pathways, seasonal patterns, and field conditions before selecting controls.
Table of Contents
Introduction
Water quality management is the engineering process of monitoring, protecting, improving, and maintaining water so it can support intended uses such as drinking water supply, recreation, aquatic habitat, irrigation, and industrial use. It connects water quality standards, field sampling, pollutant sources, treatment options, watershed controls, and long-term performance verification.
Water Quality Management Process
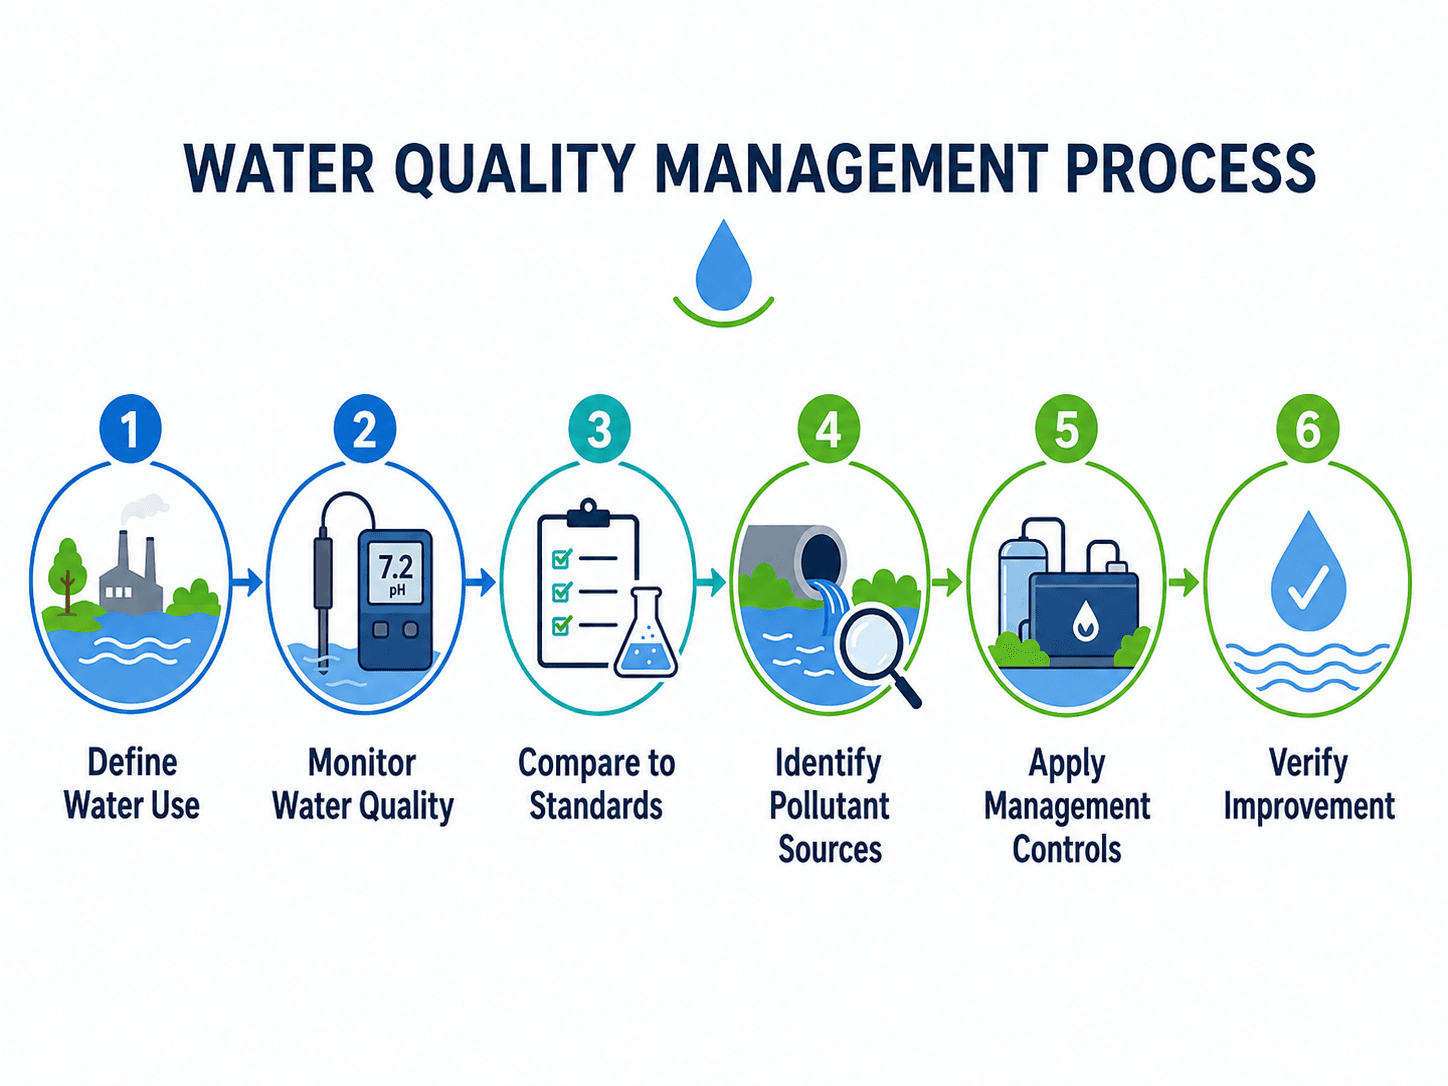
The most important idea is that water quality management is not just testing water. Testing produces data; management turns that data into defensible engineering action.
What Is Water Quality Management?
Water quality management is the planned process of maintaining or improving the physical, chemical, biological, and habitat conditions of a water body or water system. It may apply to a stream, lake, reservoir, aquifer, stormwater network, treatment plant source water, industrial discharge, or receiving water downstream of a project.
In practice, engineers do not ask whether water is simply “clean” or “dirty.” They ask whether the water is suitable for a specific use. A reservoir used for drinking water supply is managed differently than a warm-water stream, an urban stormwater pond, an irrigation canal, or a groundwater well field. The management target depends on the intended use, pollutant sources, site hydrology, monitoring data, and applicable water quality criteria.
Water quality is use-specific. The same measured condition may be acceptable for one water use and unacceptable for another, which is why engineers begin by defining the water body, intended use, and management objective before selecting parameters or controls.
Why Water Quality Management Matters in Water Resources Engineering
Water resources engineering is not only about moving water. It also deals with whether that water can be safely used, stored, treated, discharged, reused, or released back into the environment. Poor water quality can reduce treatment reliability, damage aquatic habitat, close recreational waters, limit groundwater use, increase operations cost, and create downstream impacts that are difficult to reverse.
Water quality management is especially important where hydrology and land use interact. A small watershed with heavy construction, agriculture, industry, or dense urban cover can generate very different pollutant loads than a mostly forested watershed with the same rainfall. That is why engineers connect water quality to runoff, flow timing, storage, land disturbance, treatment trains, and long-term maintenance.
| Water resources setting | Typical water quality concern | Engineering response |
|---|---|---|
| Urban stormwater system | Sediment, oil, metals, bacteria, trash, nutrients, and thermal impacts from runoff. | Use source control, catch basins, bioretention, detention, filtration, maintenance, and targeted monitoring. |
| Reservoir or lake | Nutrient enrichment, algae growth, low dissolved oxygen, turbidity, taste and odor issues, and sediment accumulation. | Manage watershed inputs, residence time, shoreline erosion, monitoring locations, and treatment plant source water risk. |
| Groundwater system | Nitrates, dissolved minerals, industrial chemicals, salinity, pathogens near shallow wells, and plume movement. | Review wellhead protection, land use, hydrogeology, sampling depth, flow direction, and source control options. |
| Stream or river | High temperature, low dissolved oxygen, bacteria, sediment, habitat degradation, and pollutant loads from upstream sources. | Evaluate upstream and downstream monitoring, baseflow, storm response, riparian buffers, discharges, and channel condition. |
What a Water Quality Management Plan Should Include
A water quality management plan should explain how water quality will be evaluated, what conditions need to be protected or improved, which pollutant sources are most likely, and how selected actions will be checked over time. A good plan is not just a sampling schedule; it is a decision framework.
| Plan element | What it includes | Why it matters |
|---|---|---|
| Management objective | Drinking water supply, recreation, aquatic life, stormwater control, groundwater protection, wastewater receiving water, or watershed restoration. | Defines what “acceptable water quality” means for the project. |
| Designated use | The protected or intended use of the water body. | Determines which criteria and performance goals should be used. |
| Monitoring locations | Upstream, downstream, inflow, outfall, groundwater, reservoir depth, control site, or treatment process points. | Prevents misleading conclusions about where pollutants are coming from. |
| Parameters | pH, dissolved oxygen, turbidity, total suspended solids, nutrients, bacteria, metals, conductivity, temperature, and habitat indicators. | Connects testing to likely pollutants and management decisions. |
| Sampling frequency | Routine, seasonal, dry-weather, wet-weather, event-based, continuous, or follow-up sampling. | Captures variability that one-time sampling can miss. |
| Source assessment | Land use, outfalls, erosion areas, septic systems, agriculture, industrial activity, maintenance records, and drainage pathways. | Links water quality problems to practical corrective actions. |
| Management actions | BMPs, source control, treatment upgrades, maintenance, restoration, operating changes, or enforcement support. | Turns monitoring results into actual water quality improvement. |
| Verification method | Post-project monitoring, trend review, maintenance tracking, and performance comparison. | Confirms whether the selected actions are working or need adjustment. |
A useful plan should make it clear what decision will be made from each type of data. If a monitoring result cannot trigger a design, maintenance, treatment, source-control, or investigation decision, the sampling program may need to be refined.
How Engineers Interpret Water Quality Data
Water quality data is most useful when it is interpreted in context. A number by itself does not explain whether a source is active, whether a trend is worsening, whether a standard is exceeded, or whether a control is working. Engineers interpret the result alongside flow, location, timing, land use, sampling method, and historical data.
| Interpretation issue | What engineers compare | Why it changes the decision |
|---|---|---|
| Concentration vs. load | Pollutant concentration and streamflow or discharge rate. | A low concentration at high flow can still deliver a large total pollutant mass to the receiving water. |
| Single sample vs. trend | One result, repeated results, seasonal patterns, and long-term monitoring data. | Trends help distinguish persistent problems from short-term variability. |
| Dry-weather vs. wet-weather data | Baseflow results and runoff-event results. | Storm events often control sediment, bacteria, nutrients, oils, metals, and trash loads. |
| Upstream vs. downstream comparison | Background conditions and conditions below a suspected source. | Helps isolate whether the project area or watershed reach is contributing to the problem. |
| Grab sample vs. continuous monitoring | Single-time lab results and high-frequency sensor data. | Continuous monitoring can reveal daily cycles, first-flush events, or short-duration exceedances that grab samples miss. |
| Field screening vs. lab confirmation | Portable meter readings, visual inspection, and certified laboratory analysis. | Field screening is useful for rapid diagnosis, but critical decisions often require validated methods and QA/QC. |
A common water resources concept is pollutant load. Load combines concentration and flow so engineers can evaluate the total amount of pollutant delivered to a water body over time.
This concept matters because a small stream with a high concentration may create a localized concern, while a large storm flow with a moderate concentration may deliver a much larger total load downstream. For reservoirs, impaired waters, watershed planning, and treatment planning, load can be more useful than concentration alone.
Key Water Quality Parameters Engineers Monitor
Water quality is measured through groups of indicators rather than one universal value. Engineers typically evaluate physical, chemical, biological, and habitat indicators together so the data reflects both pollutant conditions and how the water body functions.
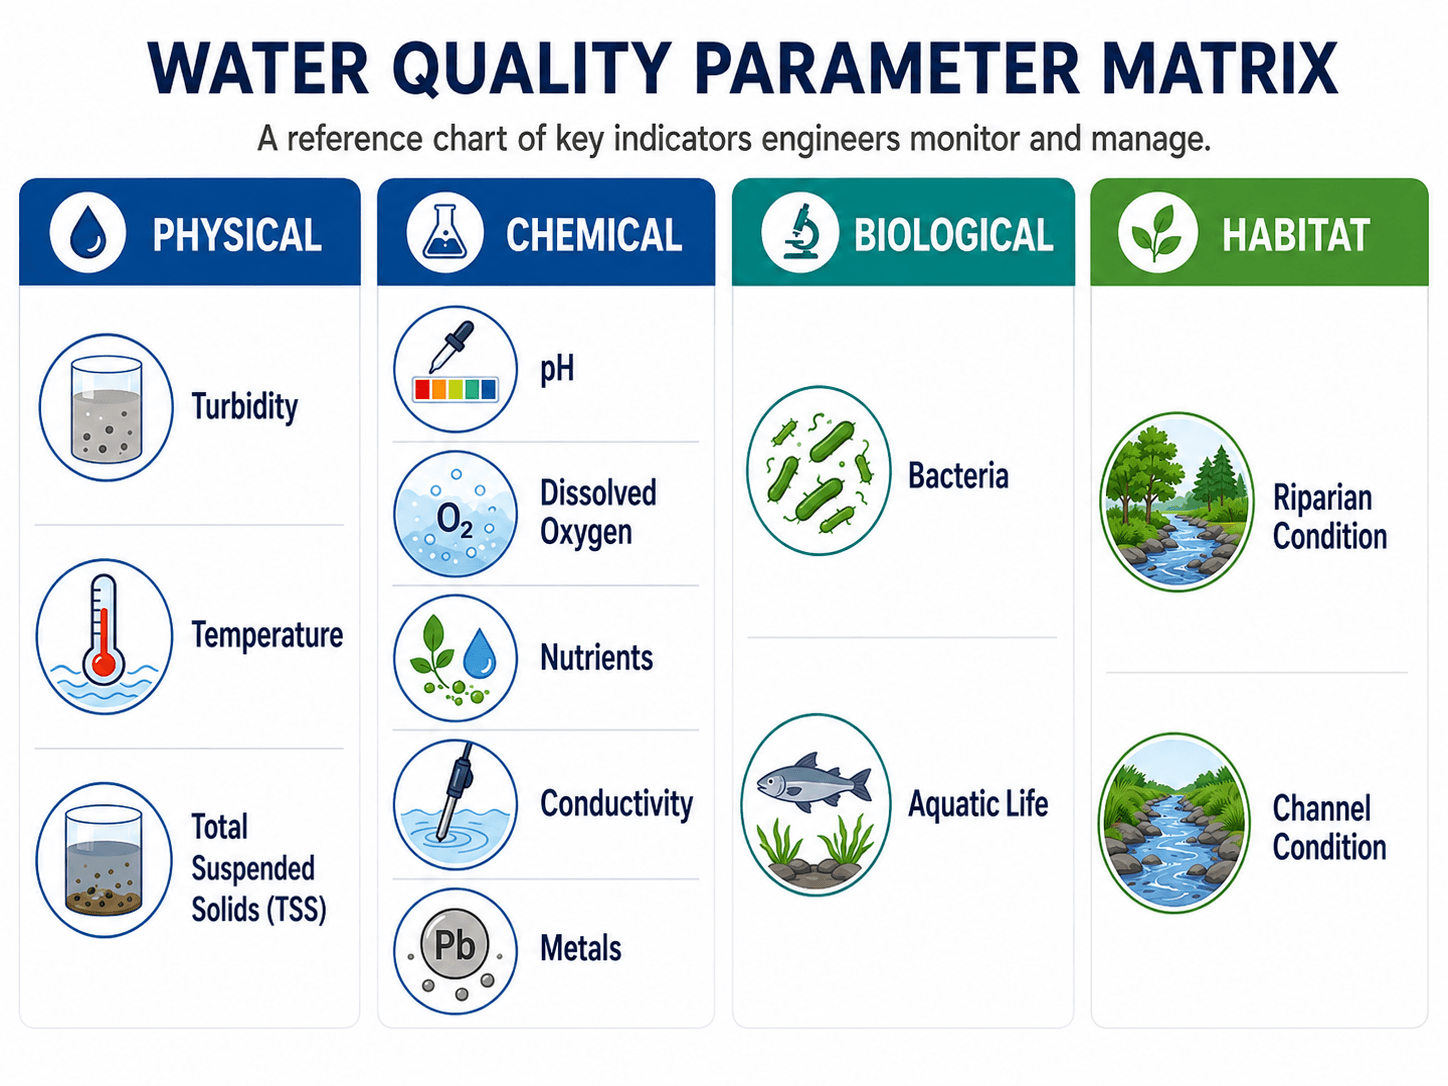
The graphic shows the most common categories first. Physical parameters help identify sediment, temperature, and clarity issues. Chemical parameters help diagnose oxygen, nutrient, salinity, and contaminant concerns. Biological and habitat indicators help confirm whether the water body is supporting aquatic life and stable stream conditions.
| Parameter | What it indicates | Engineering implication |
|---|---|---|
| pH | Acidity or alkalinity of the water. | Affects corrosion, chemical treatment, aquatic life, metal solubility, and disinfection performance. |
| Turbidity | Cloudiness caused by fine particles, algae, or suspended material. | Can indicate erosion, treatment difficulty, storm response, or poor sediment control. |
| Total suspended solids (TSS) | Mass of suspended material in the water column. | Important for erosion control, stormwater BMP performance, sediment transport, and receiving water impacts. |
| Dissolved oxygen | Oxygen available for aquatic organisms. | Low values may indicate organic loading, stagnant conditions, high temperature, algae cycles, or ecosystem stress. |
| Nutrients | Nitrogen and phosphorus compounds that can fuel plant and algae growth. | Excess nutrients can lead to algal blooms, oxygen depletion, taste and odor issues, and reservoir management problems. |
| Bacteria | Potential fecal contamination and public health risk. | Often controls recreation decisions, stormwater investigations, wastewater impacts, and watershed source tracking. |
| Conductivity | Dissolved ions and salinity-related changes. | Useful for tracking salts, groundwater influence, industrial discharge, mine drainage, or runoff chemistry changes. |
| Metals | Potential toxic contaminants such as lead, copper, zinc, arsenic, or mercury. | Requires careful source review, dissolved versus total metal interpretation, toxicity context, and sometimes treatment or source control. |
| Habitat and aquatic life | Condition of the stream channel, riparian area, substrate, organisms, and ecological response. | Helps explain why chemical data alone may not reflect the real health of the water body. |
Pollutant Sources and Control Strategies
A water quality problem is usually the visible result of a source, a transport pathway, and a receiving water condition. The same pollutant can come from several land uses, and the same site can contribute multiple pollutants during different weather conditions.
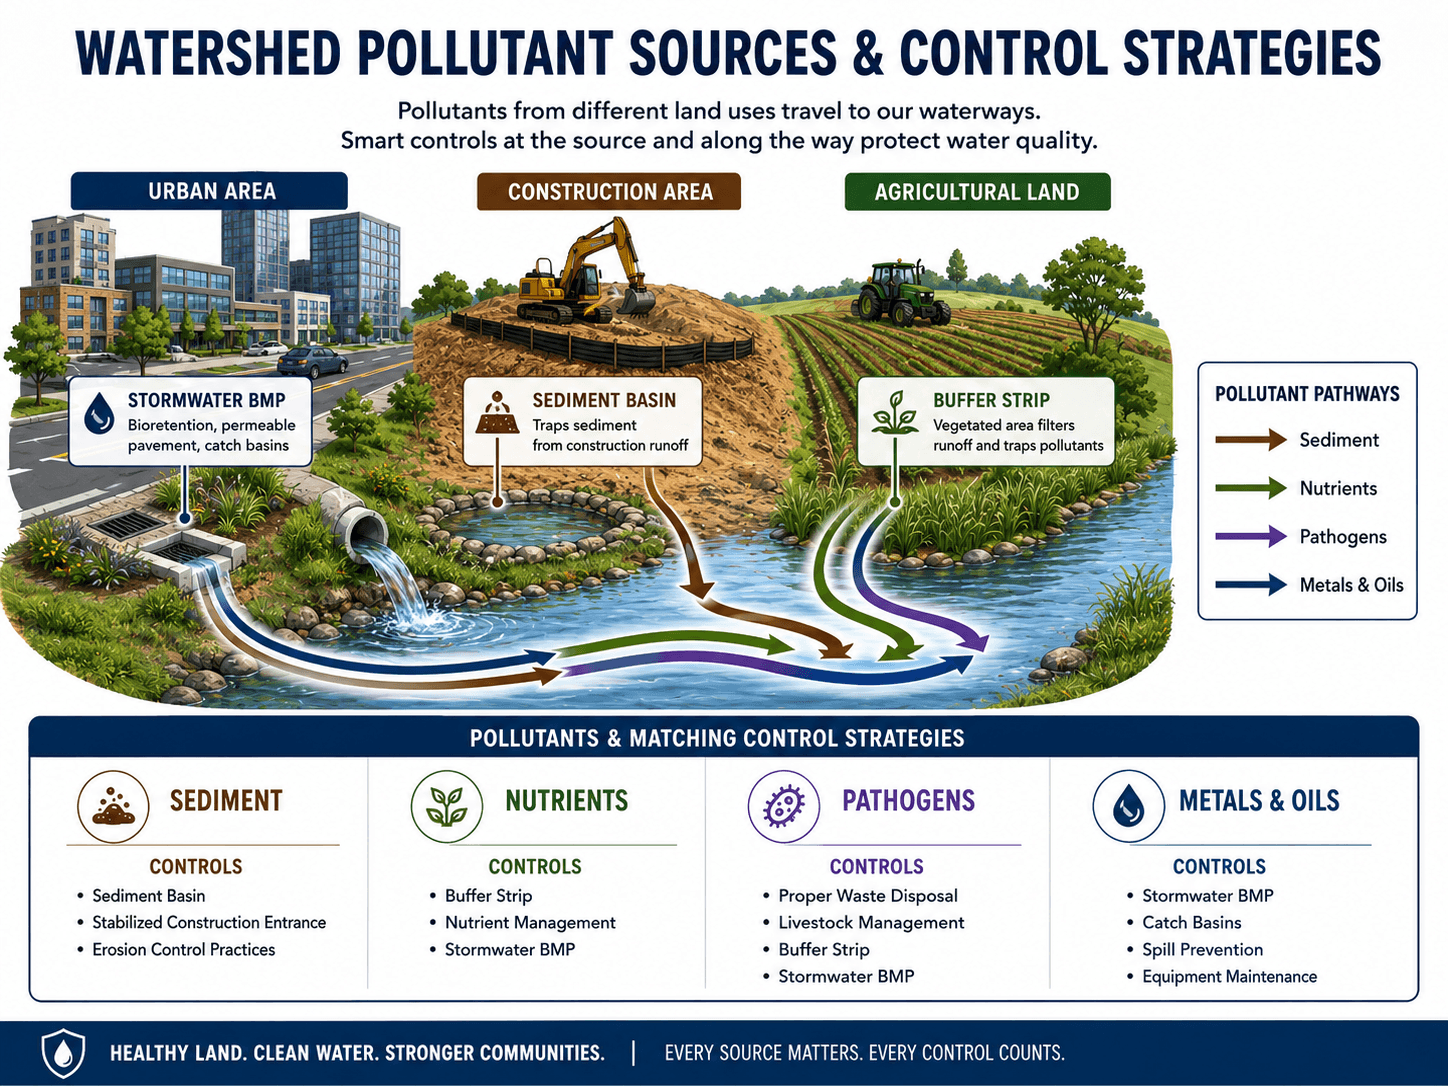
The key takeaway from this visual is source matching. Sediment needs erosion and sediment controls. Nutrients need source reduction, buffers, and treatment strategies that address dissolved or particulate forms. Metals and oils usually require source control, pretreatment, and maintenance. Pathogens require waste-source tracking and control.
| Pollutant concern | Common sources | Management strategies |
|---|---|---|
| Sediment | Construction disturbance, streambank erosion, unpaved roads, agricultural fields, exposed soil, and failed stabilization. | Stabilized entrances, sediment basins, erosion control blankets, vegetated buffers, phased grading, and inspection after storms. |
| Nutrients | Fertilizer, manure, septic systems, wastewater inputs, lawn runoff, agricultural drainage, and internal lake loading. | Nutrient management plans, buffers, wet ponds, constructed wetlands, soil conservation, source reduction, and treatment optimization. |
| Pathogens | Sanitary sewer overflows, failing septic systems, livestock, wildlife concentration, pet waste, and stormwater runoff. | Source tracking, waste controls, sewer repairs, livestock exclusion, proper disposal practices, and targeted bacteria monitoring. |
| Metals and oils | Roadways, parking lots, industrial yards, vehicle maintenance, roof runoff, spills, and legacy contamination. | Spill prevention, pretreatment, catch basin maintenance, filtration, source control, industrial housekeeping, and outfall inspections. |
| Low dissolved oxygen | Organic loading, algae decay, stagnant flow, warm water, excessive nutrients, and poor circulation. | Reduce nutrient and organic loads, improve mixing where appropriate, restore riparian shading, and evaluate flow and residence time. |
A downstream sample may show the symptom, but not the source. Engineers often need upstream/downstream sampling, wet-weather sampling, land-use review, outfall screening, and maintenance records before choosing a control strategy.
How Management Changes by Water System Type
The basic management logic stays the same, but the best monitoring approach and control strategy change by water system type. A shallow groundwater plume, a stormwater outfall, a lake with algae blooms, and a river downstream of a discharge require different sampling locations, time scales, and corrective actions.
| System type | Main concern | Monitoring approach | Typical controls |
|---|---|---|---|
| Streams and rivers | Flow-driven pollutant movement, bacteria, dissolved oxygen, temperature, sediment, and habitat condition. | Upstream/downstream sampling, baseflow monitoring, storm-event sampling, and habitat assessment. | Source control, riparian restoration, erosion reduction, discharge management, and watershed BMPs. |
| Lakes and reservoirs | Nutrients, algae growth, stratification, taste and odor issues, turbidity, and sediment accumulation. | Tributary sampling, depth profiles, seasonal monitoring, and source-water trend review. | Nutrient reduction, watershed controls, shoreline stabilization, aeration where appropriate, and treatment planning. |
| Stormwater systems | First-flush pollutants, sediment, oils, metals, bacteria, trash, and temperature increases from impervious areas. | Outfall inspections, wet-weather sampling, BMP performance checks, and maintenance tracking. | Bioretention, sediment basins, filtration, permeable pavement, catch basin maintenance, and spill prevention. |
| Groundwater | Dissolved contaminants, nitrate, salts, solvents, plume migration, well impacts, and recharge-area risks. | Monitoring wells, depth-specific sampling, groundwater elevation review, and flow direction assessment. | Source protection, wellhead protection, land-use controls, remediation, treatment, and monitored attenuation where appropriate. |
Water Quality Standards, Criteria, and Designated Uses
Water quality management is tied to designated uses and criteria. A designated use describes what the water body is expected to support, such as aquatic life, recreation, drinking water supply, agriculture, or industrial use. Criteria provide the numeric or narrative conditions used to protect that use.
The three-part standards framework
Water quality standards are commonly understood through three connected ideas: designated uses, water quality criteria, and antidegradation. Designated uses define what the water should support. Criteria describe the pollutant levels or conditions needed to protect those uses. Antidegradation helps protect existing water quality where it is already better than minimum requirements.
| Concept | Meaning in water quality management | Practical engineering use |
|---|---|---|
| Designated use | The intended use or condition the water body is expected to support. | Defines the management objective before choosing parameters, criteria, or controls. |
| Water quality criteria | Numeric or narrative values used to protect a designated use. | Provides a benchmark for evaluating monitoring data and potential impairment. |
| Monitoring plan | The sampling locations, parameters, timing, methods, and QA/QC procedures. | Determines whether the data can support a defensible management decision. |
| Antidegradation concept | A framework intended to help protect existing water quality where it is already better than minimum requirements. | Matters in planning, permitting, and evaluating whether a project may lower existing water quality. |
Where impaired waters and TMDLs fit
If a water body does not meet applicable water quality standards, it may be identified as impaired. A total maximum daily load, often called a TMDL, may then be used to estimate the pollutant reduction needed for the water body to meet its designated use. Engineers may support this work through monitoring, pollutant load estimates, BMP selection, treatment upgrades, watershed modeling, and verification.
Water Quality Management vs. Water Treatment
Water quality management and water treatment are closely related, but they are not the same. Management is the broader process of defining objectives, monitoring conditions, identifying pollutant sources, applying controls, and verifying results. Treatment is one possible control method used to remove or reduce contaminants.
| Topic | Water quality management | Water treatment |
|---|---|---|
| Primary focus | Protecting or improving a water body, watershed, source water, discharge, or water system. | Removing particles, microorganisms, dissolved chemicals, or other contaminants from water. |
| Typical scale | Watershed, stream, reservoir, aquifer, drainage network, or receiving water. | Treatment plant, unit process, package system, industrial pretreatment, or point-of-use process. |
| Common decisions | What to monitor, where sources are located, which controls fit, and how to verify improvement. | Which treatment train, chemical dose, filtration method, disinfection approach, or process control is needed. |
| Typical tools | Monitoring plans, watershed models, inspections, BMPs, standards, source tracking, and trend analysis. | Coagulation, flocculation, sedimentation, filtration, adsorption, membranes, disinfection, and chemical treatment. |
For example, a reservoir with high turbidity after storms may require watershed erosion control as part of management and improved coagulation or filtration performance as part of treatment. The best solution often combines both.
Senior Engineer Water Quality Management Review Checklist
A water quality plan should be reviewed as a decision system, not just a list of lab results. The checklist below helps identify whether the plan connects the management objective, monitoring design, source diagnosis, control strategy, and verification method.
Start with the intended water use. Select parameters that match the likely pollutant sources. Sample at locations and times that can separate background conditions from project impacts. Compare results to applicable criteria and trends. Match controls to sources. Re-monitor after implementation to confirm whether the action worked.
| Review check | What to look for | Why it matters |
|---|---|---|
| Management objective | Clear statement of whether the goal is source water protection, aquatic life, recreation, permit compliance, stormwater control, or watershed restoration. | Without a defined objective, monitoring results may not lead to a useful decision. |
| Designated use and criteria | Correct water body use, applicable criteria, permit requirements, or project-specific performance targets. | The same measured value can mean different things for different water uses. |
| Parameter selection | Parameters that match the suspected pollutant source, such as turbidity for sediment or nutrients for algae risk. | Testing the wrong indicators can make a plan look active while missing the real problem. |
| Sampling location | Upstream, downstream, inflow, outflow, outfall, groundwater, or control locations that isolate sources. | Bad sampling locations can hide impacts or blame the wrong source. |
| Sampling timing | Dry-weather, wet-weather, seasonal, baseflow, and event-based sampling where relevant. | Many pollutant loads occur during storms or seasonal transitions, not during convenient sampling windows. |
| Data quality | Proper bottle handling, preservation, field calibration, lab method, detection limits, and chain of custody. | Management decisions are only as strong as the data behind them. |
| Source diagnosis | Land use, outfalls, erosion areas, maintenance records, discharge points, groundwater pathways, and field observations. | Controls must address the source and pathway, not just the downstream symptom. |
| Verification plan | Post-control monitoring, maintenance tracking, trend analysis, and performance review. | A management action is incomplete until improvement is verified or the plan is adjusted. |
Example: Turning Monitoring Data Into a Management Action
Consider an urban watershed where stream turbidity and total suspended solids increase sharply after moderate rain events. A shallow review might conclude that the stream is simply “muddy after storms,” but water quality management asks a more useful question: where is the sediment coming from, and what control will reduce it?
Step 1: Separate background conditions from project impacts
Engineers would compare upstream and downstream samples, review rainfall timing, inspect outfalls, and look for exposed soil, channel erosion, construction activity, or failed stabilization. If upstream turbidity is low and downstream turbidity spikes after passing a disturbed area, the likely source pathway becomes clearer.
Step 2: Match the control to the pathway
If the source is construction runoff, controls may include stabilized entrances, sediment basins, inlet protection, temporary cover, phased grading, and more frequent inspections after storms. If the source is streambank erosion, the solution may involve channel stabilization, riparian restoration, flow management, or upstream stormwater volume reduction.
Step 3: Verify improvement
After controls are installed, engineers compare new storm-event samples to earlier conditions. If turbidity improves but nutrients remain high, the plan may need a second phase focused on fertilizer, wastewater, septic, or watershed nutrient sources.
Engineering Judgment and Field Reality
Real water quality management is affected by storm timing, land use changes, maintenance quality, sampling access, flow variation, seasonal temperature, algae cycles, sediment storage, and legacy contamination. A parameter can change for reasons unrelated to the most obvious nearby source, which is why experienced engineers avoid drawing conclusions from one sample or one visual observation.
A clear stream is not always healthy, and a cloudy stream is not always caused by the nearest construction site. Groundwater inputs, upstream erosion, algae, resuspended sediment, natural soil conditions, and storm timing can all affect what a field crew sees on a given day.
Field judgment also matters when selecting controls. A detention pond may help settle sediment but may not solve dissolved nutrient problems. A buffer strip may reduce runoff impacts but will not correct an industrial spill source. A treatment plant process may improve finished water but cannot fully compensate for unmanaged source water degradation over the long term.
When This Breaks Down
Water quality management breaks down when monitoring, standards, sources, and controls are treated as separate tasks instead of one connected decision process. The most common failures occur when the plan collects data without a clear purpose or installs controls without proving they address the pollutant pathway.
- Sampling is not representative: Results can mislead if samples are taken at the wrong location, during the wrong flow condition, or without a consistent method.
- Controls do not match pollutants: A sediment basin may not remove dissolved nutrients, bacteria, salts, or dissolved metals at meaningful levels.
- Maintenance is ignored: Stormwater BMPs, sediment controls, sensors, outfalls, and treatment units can lose performance when inspection and maintenance are weak.
- Natural variability is mistaken for a trend: Seasonal temperature, rainfall, drought, baseflow, algae cycles, and sediment resuspension can all change results.
- Standards are used without context: Criteria must be interpreted with the designated use, water body type, sampling method, and project requirements.
Common Mistakes and Practical Checks
The biggest mistake in water quality management is assuming that data collection alone equals management. Data is useful only when it supports a decision about risk, source control, treatment, maintenance, design, or verification.
| Common mistake | Why it causes bad decisions | Better engineering practice |
|---|---|---|
| Sampling only in dry weather | Can miss storm-driven pollutant loads from runoff, erosion, outfalls, and first-flush effects. | Include wet-weather or event-based monitoring where runoff controls the pollutant pathway. |
| Using one sample as proof | One result may reflect a short-term condition, sampling error, or natural variability. | Compare repeated samples, seasons, flow conditions, and upstream/downstream results. |
| Treating all pollutants the same | A BMP that removes particles may not remove dissolved nutrients, salts, bacteria, or metals. | Match controls to pollutant form, source, flow path, and receiving water objective. |
| Ignoring maintenance | BMPs, catch basins, sensors, sediment traps, and treatment units lose performance over time. | Include inspection frequency, maintenance responsibility, and performance verification. |
| Confusing treatment with management | Treatment may reduce contaminants at one point but not address the upstream source. | Combine source control, watershed planning, BMPs, treatment, and monitoring where needed. |
Do not select a BMP or treatment process before identifying the pollutant form, source, pathway, and management objective. A control that works for visible sediment may be ineffective for dissolved nutrients, bacteria, salts, or metals.
Relevant Standards, Data Sources, and Design References
Water quality management often depends on federal, state, tribal, local, owner, and project-specific requirements. Engineers use standards and guidance to understand designated uses, water quality criteria, antidegradation concepts, assessment methods, and water quality-based planning.
- EPA Water Quality Standards Handbook: EPA Water Quality Standards Handbook provides authoritative background on water quality standards, designated uses, criteria, implementation guidance, and the water quality-based approach to pollution control.
- Project-specific criteria: Local permits, stormwater manuals, watershed plans, utility requirements, receiving water conditions, and owner objectives may control what must be monitored and how results are interpreted.
- Engineering use: The reference framework helps engineers connect field data to water body uses, pollutant limits, source control, treatment performance, and long-term verification.
Frequently Asked Questions
Water quality management is the engineering process of monitoring, protecting, improving, and maintaining water so it can support intended uses such as drinking water supply, recreation, aquatic habitat, irrigation, industrial use, and ecosystem health.
The main steps are defining the intended water use, monitoring key water quality indicators, comparing results to standards or project criteria, identifying pollutant sources, applying management controls, and verifying whether conditions improve over time.
Common water quality parameters include pH, turbidity, temperature, total suspended solids, dissolved oxygen, nutrients, conductivity, bacteria, metals, aquatic life indicators, and habitat condition. The right parameters depend on the water body, pollutant sources, and management objective.
Water quality management is the broader planning and decision process used to protect or improve water conditions. Water treatment is a specific engineered process, such as coagulation, filtration, disinfection, or chemical treatment, used to remove or reduce contaminants.
Water quality monitoring is the collection of field and laboratory data. Water quality management uses that data to identify problems, compare results to criteria, select controls, maintain systems, and verify whether water conditions improve.
Water quality can become poor because of sediment, nutrients, bacteria, low dissolved oxygen, metals, oils, salts, high temperature, toxic chemicals, excessive algae, habitat degradation, or pollutant loads delivered during storms or discharges.
Summary and Next Steps
Water quality management is the process of turning monitoring data into engineering decisions that protect public health, aquatic ecosystems, water supply reliability, recreation, and long-term water resource value. It requires more than a lab report; it requires a clear objective, correct parameters, defensible sampling, source diagnosis, and verification.
The most effective plans connect water use, pollutant sources, standards, hydrology, treatment options, field conditions, and maintenance reality. Engineers improve water quality by matching controls to the actual pollutant pathway and by checking whether the selected actions work over time.
Where to go next
Continue your learning path with related Turn2Engineering resources.
-
Stormwater Management
Learn how runoff controls, drainage design, BMPs, and watershed planning reduce flooding and pollutant transport.
-
Water Treatment Processes
See how treatment trains remove particles, microorganisms, dissolved chemicals, and other water quality concerns.
-
Water Resources Modeling
Explore how models help evaluate water systems, scenarios, pollutant transport, hydrology, and management alternatives.