Key Takeaways
- Definition: The Standard Proctor Test is a laboratory compaction test that identifies a soil’s optimum moisture content and maximum dry density under a standardized compactive effort.
- Use case: Engineers use it to set earthwork and subgrade targets such as percent compaction and acceptable moisture range during construction.
- Main decision: The critical judgment is whether Standard Proctor is the correct reference energy for the project or whether a higher-effort benchmark is needed.
- Outcome: After reading, you should be able to interpret the curve, understand the equations behind it, and connect lab results to field density acceptance.
Table of Contents
Introduction
In brief: The Standard Proctor Test shows how soil dry density changes with water content so engineers can identify optimum moisture content and maximum dry density for compaction control.
Who it’s for: Students, inspectors, and geotechnical designers.
If you work with fill, subgrade, pads, embankments, or backfill, this test is one of the main links between soil behavior in the lab and compaction acceptance in the field.
Standard Proctor Test infographic
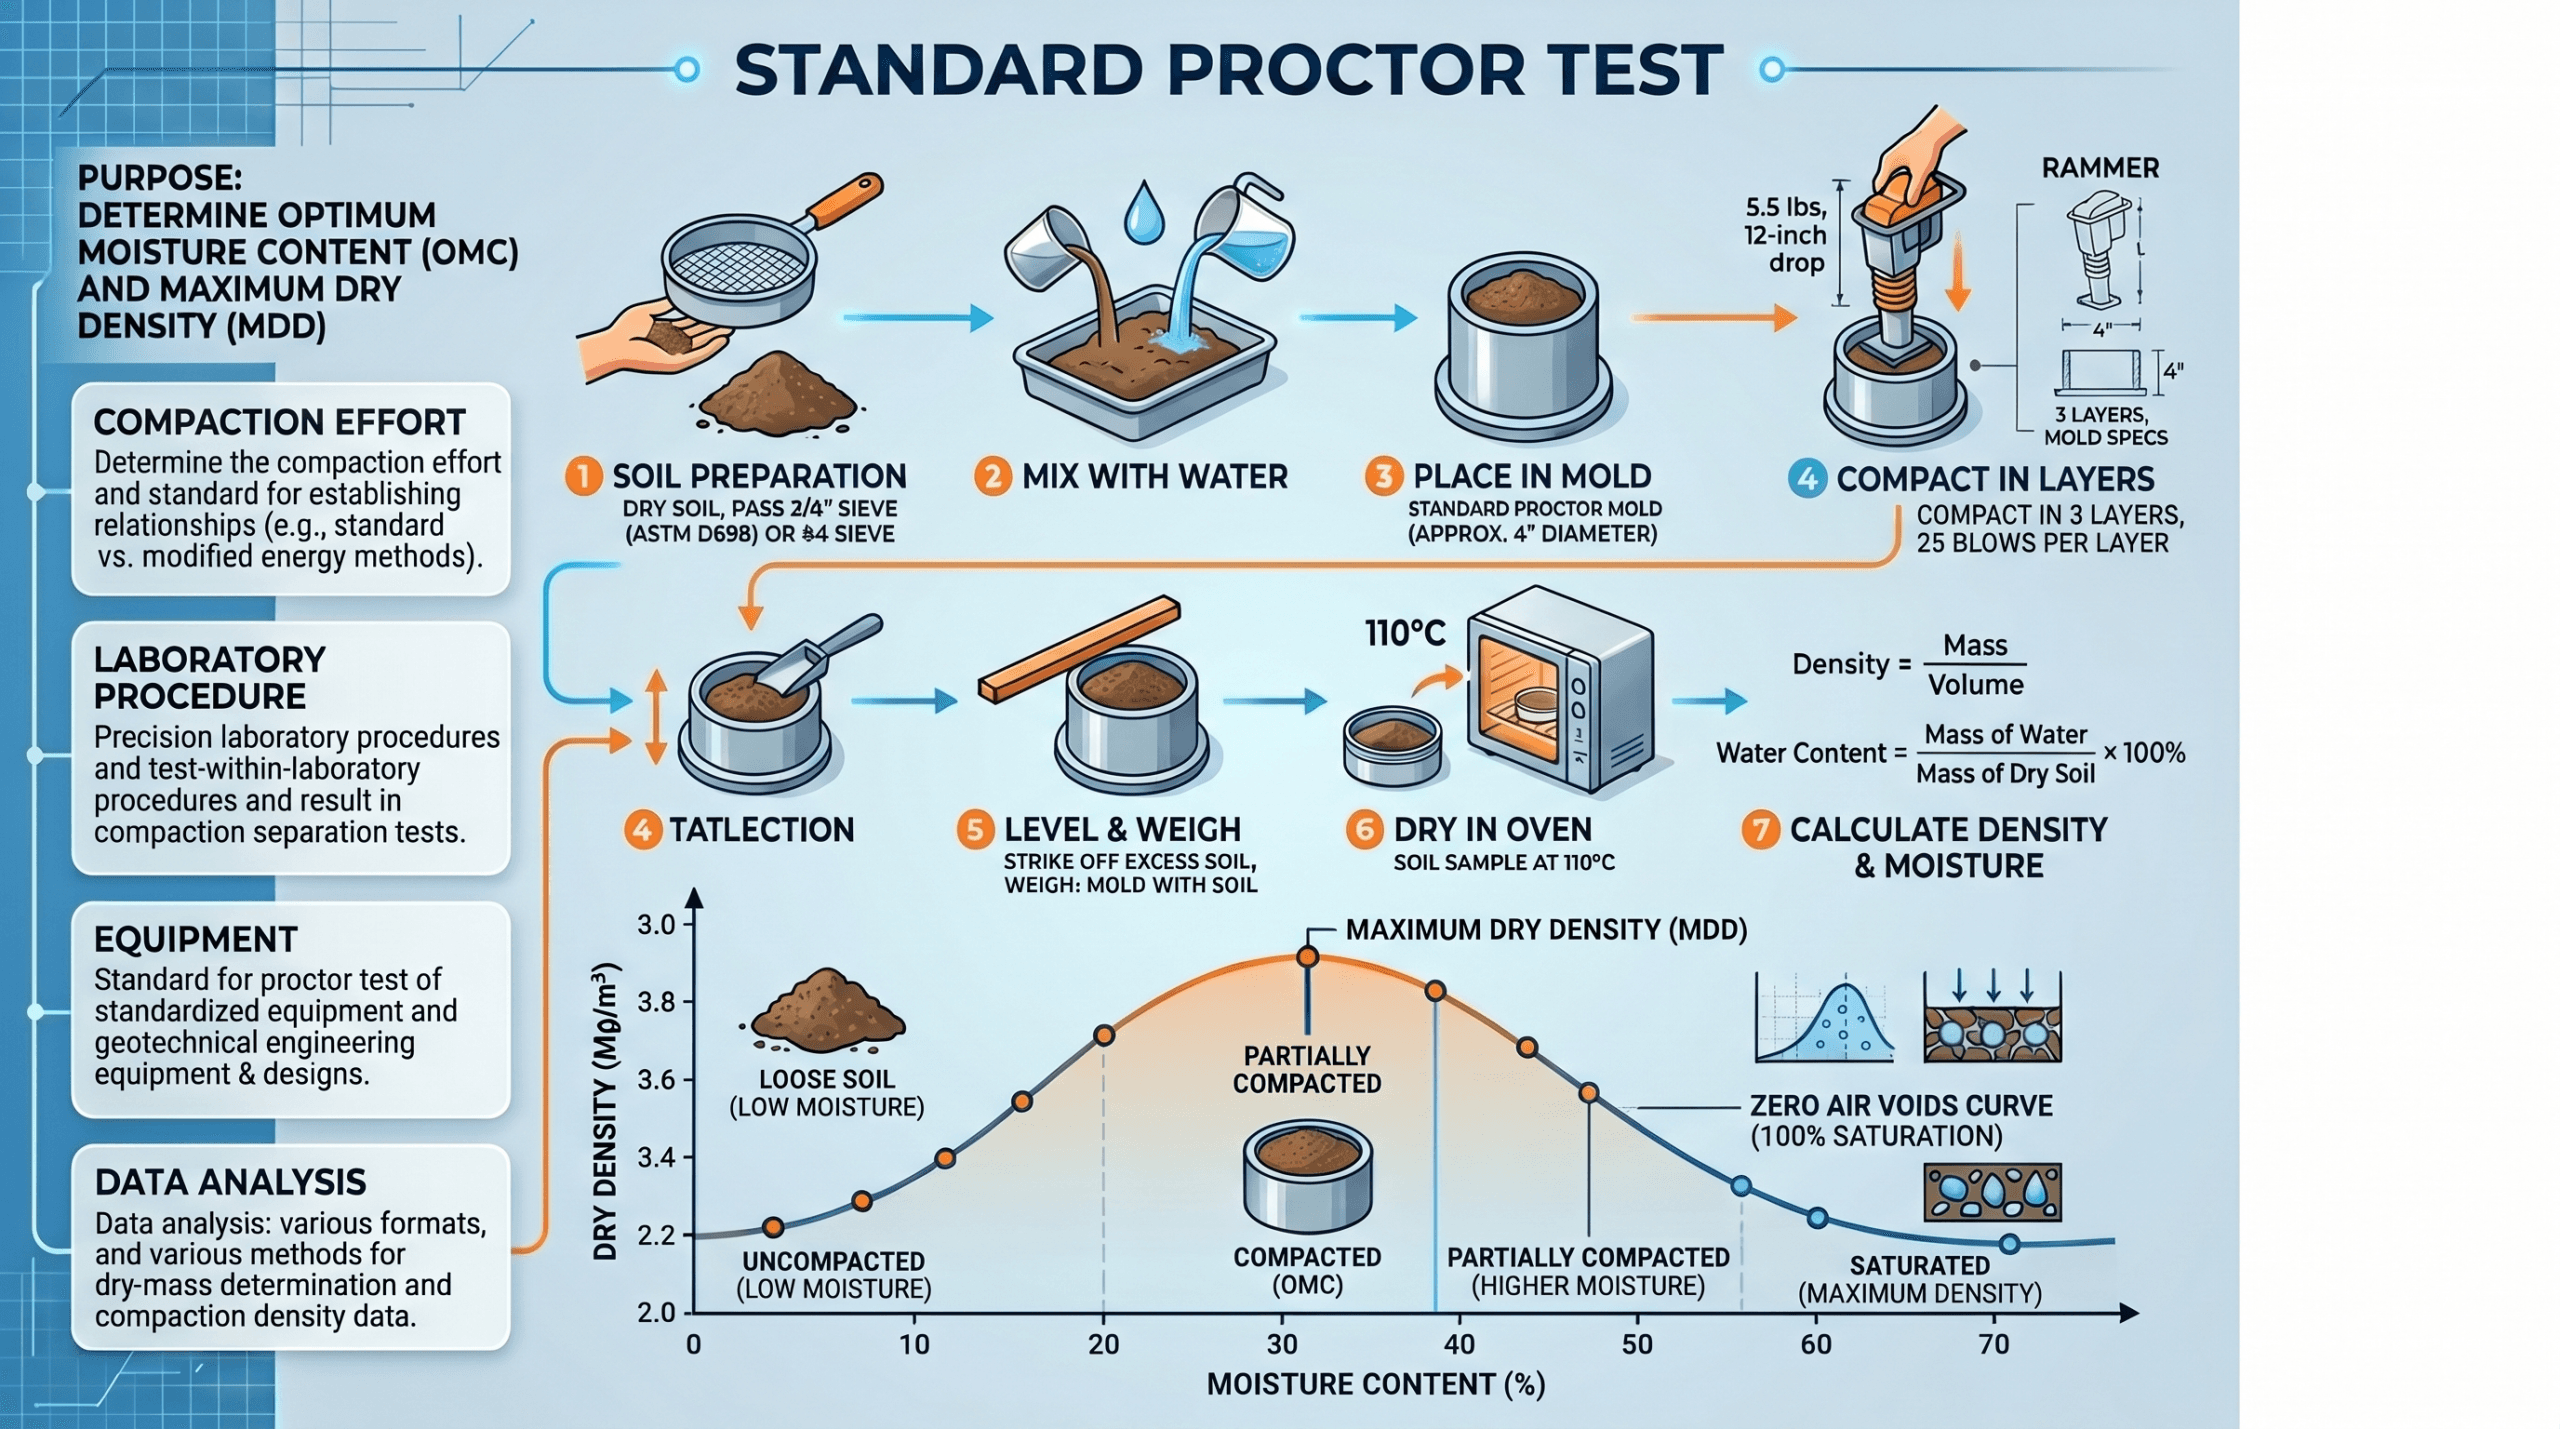
Notice that the curve rises as added water helps particles rearrange more efficiently, then falls after excess water begins displacing air without improving the soil skeleton. That shape is the whole reason the test is useful: it gives compaction a target, not just a rule of thumb.
What is the Standard Proctor Test?
The Standard Proctor Test is a laboratory method used to determine how densely a soil can be compacted at different water contents when a fixed, standardized amount of compactive energy is applied. The output is the familiar moisture-density curve, from which engineers read the optimum moisture content and the maximum dry density.
In practice, those two values drive specifications such as “compact to at least 95% of Standard Proctor” or “compact within minus 2 to plus 2 percentage points of optimum moisture.” That makes the test central to earthwork, roadway subgrades, structural fill, utility trench backfill, and building pad preparation.
The Standard Proctor Test is not the whole compaction story. It works alongside Compaction Test acceptance in the field, plus soil classification tools like Sieve Analysis, Atterberg Limits, and broader fundamentals from Soil Mechanics.
Core principles, variables, and units
The test is built on a simple idea: soil compaction is controlled by both energy and water. Too little water and the particles cannot rearrange efficiently. Too much water and pore water begins occupying space that cannot contribute to dry density. Somewhere in between is the best moisture condition for the specified compactive effort.
Key variables and typical ranges
Fine-grained soils often show higher optimum moisture contents and lower maximum dry densities than clean granular soils. Highly plastic clays may compact best at noticeably wetter conditions than silty sands or crushed aggregate fills. That is why the test must be performed on the actual project material rather than assumed from a generic soil type.
- w Water content, usually reported as percent by dry mass of soil.
- γ Bulk or wet unit weight, commonly pcf or kN/m³, measured from compacted mold mass and volume.
- γd Dry unit weight, the key value plotted against moisture content to build the compaction curve.
- OMC Optimum moisture content where the Standard Proctor curve reaches its peak.
- MDD Maximum dry density achieved at OMC for the specified Standard Proctor energy.
Always think of OMC and MDD as a pair. A density target without a moisture window often leads to overwatering, undercompaction, or misleading field results.
Decision logic or design workflow
Engineers usually follow the same workflow when using Standard Proctor data: identify the material, run or review classification tests, decide whether Standard Proctor is the appropriate reference effort, generate the curve, then convert the lab result into a field specification and test program.
Step 1: Confirm the soil being placed is representative of the design material.
Step 2: Check gradation and plasticity to understand likely compaction behavior.
Step 3: Decide whether Standard Proctor energy fits the project or whether Modified Proctor is more appropriate.
Step 4: Use the resulting OMC and MDD to write percent-compaction and moisture-range requirements.
Step 5: Verify field density by lift, location, and moisture condition during construction.
This is why the test appears constantly in Geotechnical Earthworks, foundation backfill work, and subgrade preparation for Shallow Foundations and Retaining Wall Design.
Equations and calculations
The field crew may focus on a percent-compaction target, but the lab result comes from a straightforward sequence of wet density, water content, and dry density calculations.
Here, \( \gamma_d \) is dry unit weight, \( \gamma \) is wet unit weight, and \( w \) is water content expressed as a decimal. If you use density instead of unit weight, the same form applies. The wet unit weight comes from the compacted mold mass and known mold volume, while water content is determined by oven drying.
The first equation builds each point on the lab curve. The second equation is what turns the curve into a field acceptance criterion. A soil compacted to 95% of Standard Proctor means the in-place dry density is at least 95% of the MDD found in the lab.
A percent-compaction number means little without context. Always review the actual field moisture condition, not just the density result, because dry-of-optimum and wet-of-optimum compaction can produce very different performance.
Worked example
Example
Suppose a silty clay is tested at several water contents. One trial produces a wet unit weight of 121 pcf at a water content of 14%. The dry unit weight for that point is:
After several trials, the peak of the curve occurs at about 16% moisture with an MDD of 108.5 pcf. The project specification requires 95% of Standard Proctor. The minimum acceptable field dry density becomes:
If a field test reports 104.2 pcf at 15.5% moisture, the lift likely passes both density and moisture intent. If the same density were achieved at a much drier condition, an experienced engineer might still question workability, uniformity, and long-term performance for a fine-grained fill.
Engineering judgment and field reality
The lab curve is clean. Field compaction rarely is. Real projects involve variable borrow sources, changing weather, lift thickness differences, equipment limitations, and crews trying to hit schedule. The Standard Proctor result is still useful, but it must be treated as a reference benchmark rather than a perfect prediction of field behavior.
Fine-grained soils may achieve the target density yet still perform poorly if compacted too dry and left with a brittle, cloddy structure. Conversely, some moisture-sensitive soils may be intentionally compacted slightly wet of optimum to reduce permeability or shrink-swell risk, even when that makes it harder to maximize dry density. That is where geotechnical judgment matters more than blindly chasing the peak of the curve.
A passing density test does not automatically mean a good lift. Watch for pumping, rutting, clods, segregation, unstable proof-roll response, and obvious moisture nonuniformity before accepting the work.
When this breaks down
The Standard Proctor Test starts to lose value when the project material contains too much oversized rock, when the placed fill is extremely nonuniform, or when field compaction energy is much closer to a Modified Proctor condition than a Standard one. It can also mislead when engineers assume the same compaction curve applies after the borrow source changes, the material dries out and forms hard clods, or the soil has unusual structure that is not reproduced in the laboratory remolded sample.
Another limitation is that the test tells you where density peaks for a given effort, but not everything about performance. Two fills at similar percent compaction can behave differently in strength, compressibility, hydraulic conductivity, and shrink-swell response depending on their soil fabric and moisture state. If your project is sensitive to settlement, seepage, or expansive behavior, the Standard Proctor Test should be paired with other lab and design checks, including Permeability Test, settlement evaluation, and classification data.
Common pitfalls and engineering checks
- Using an outdated Proctor curve after the material source or gradation has changed.
- Comparing field wet density directly to MDD instead of converting to dry density.
- Ignoring moisture content and accepting a density result that does not reflect good soil structure.
- Using Standard Proctor where the specification, agency, or pavement section is based on Modified Proctor.
- Assuming one target fits every zone of a project, even though structural fill, trench backfill, and embankment core materials may differ.
One of the most expensive errors in earthwork is specifying a percent compaction number without clearly naming the reference test method. “95% compaction” is incomplete unless the project states 95% of what.
| Parameter | Symbol | Typical units | Notes |
|---|---|---|---|
| Water content | w | % | Usually determined by oven drying; governs where you are on the compaction curve. |
| Wet unit weight | γ | pcf or kN/m³ | Measured from compacted mold mass and mold volume. |
| Dry unit weight | γd | pcf or kN/m³ | Plotted against moisture to find MDD and OMC. |
| Optimum moisture content | OMC | % | Benchmark moisture for the specified compactive effort, not a universal field rule. |
| Maximum dry density | MDD | pcf or kN/m³ | Used as the denominator for field percent-compaction requirements. |
Visualizing Standard Proctor Test behavior
The most useful mental image is not just “a bell-shaped curve,” but a soil structure story. Dry of optimum, the soil resists rearrangement because there is not enough water to lubricate particle movement. Near optimum, particles pack more efficiently under the same energy. Wet of optimum, water begins taking up space and preventing further dry-density gain even as compaction continues.
That dry-side versus wet-side distinction explains why two field lifts can both pass density yet have different stiffness, permeability, and long-term behavior.
Relevant standards and design references
The Standard Proctor Test is governed by established test procedures, and good project documents should name those procedures explicitly.
- ASTM D698: The core Standard Proctor laboratory compaction method used to determine OMC and MDD for many general earthwork applications.
- AASHTO T 99: The transportation-sector counterpart commonly used by roadway agencies for moisture-density relationships under standard compactive effort.
- ASTM D1557: Modified Proctor method used when higher compactive effort is needed; essential for comparison when project demands exceed Standard Proctor conditions.
- ASTM D2216: Water content determination procedure that supports the compaction calculations and quality of the plotted curve.
- ASTM D6913 / ASTM D7928 and ASTM D4318: Gradation and Atterberg-limit methods that help explain why a soil compacts the way it does and whether compaction sensitivity should be expected.
Frequently asked questions
The Standard Proctor Test uses a lower compactive effort and is commonly used for general fills, embankments, and many building pads. The Modified Proctor applies more compactive energy, usually producing a higher maximum dry density and lower optimum moisture content for higher-demand applications such as pavements and airfields.
The lab test establishes the reference maximum dry density and optimum moisture content used to write field specifications like 95 percent of Standard Proctor. Field density tests are then compared to that benchmark to confirm that placed fill is being compacted to the required condition.
It becomes less reliable when the soil contains oversized particles, highly variable moisture conditions, unusual structure, or when project performance depends on compactive effort closer to Modified Proctor conditions. The test is also a laboratory reference, not a guarantee that field equipment or lift thickness will reproduce the same soil fabric.
Optimum moisture content is the water content at which the tested soil reaches its maximum dry density under the specified Standard Proctor compactive effort. It does not mean the only moisture content that can work in the field, but it is the best laboratory benchmark for efficient compaction.
Summary and next steps
The Standard Proctor Test is one of the most practical lab tools in geotechnical engineering because it turns the vague idea of “compact it well” into measurable targets: optimum moisture content, maximum dry density, and field percent compaction. For fills, pads, subgrades, and backfill, that makes it one of the main bridges between design intent and construction quality.
The most important thing to remember is that the test is a benchmark, not a substitute for judgment. Good compaction control still requires representative materials, proper lift thickness, appropriate equipment, moisture management, and awareness of how the soil should behave in service. Use the curve, but also read the ground.
Where to go next
Continue your learning path with these closely related geotechnical topics.
-
Read a deeper dive on Compaction Test
A practical next step for understanding how Standard Proctor targets are checked in the field.
-
Study Sieve Analysis and soil classification
Useful when you want to understand why gradation changes compaction response and field sensitivity.
-
See how compaction fits into Geotechnical Earthworks
A broader project-level view of lift placement, moisture conditioning, proof rolling, and earthwork QA/QC.