
Direct Answer
Power quality describes whether the supplied voltage, frequency, and waveform are suitable for connected electrical equipment. Poor power quality includes voltage sags, swells, interruptions, transients, harmonics, flicker, voltage unbalance, and other conducted disturbances that can cause trips, resets, overheating, malfunction, or shortened equipment life.
Good troubleshooting depends on measuring the disturbance at the right location and time. Engineers compare service-entrance, feeder, nonlinear-load, and sensitive-equipment measurements to determine whether the problem originates from the utility, the facility, or the load itself.
Common Power Quality Problems
Power quality problems are classified by what changes: voltage magnitude, duration, waveform shape, balance, or frequency.
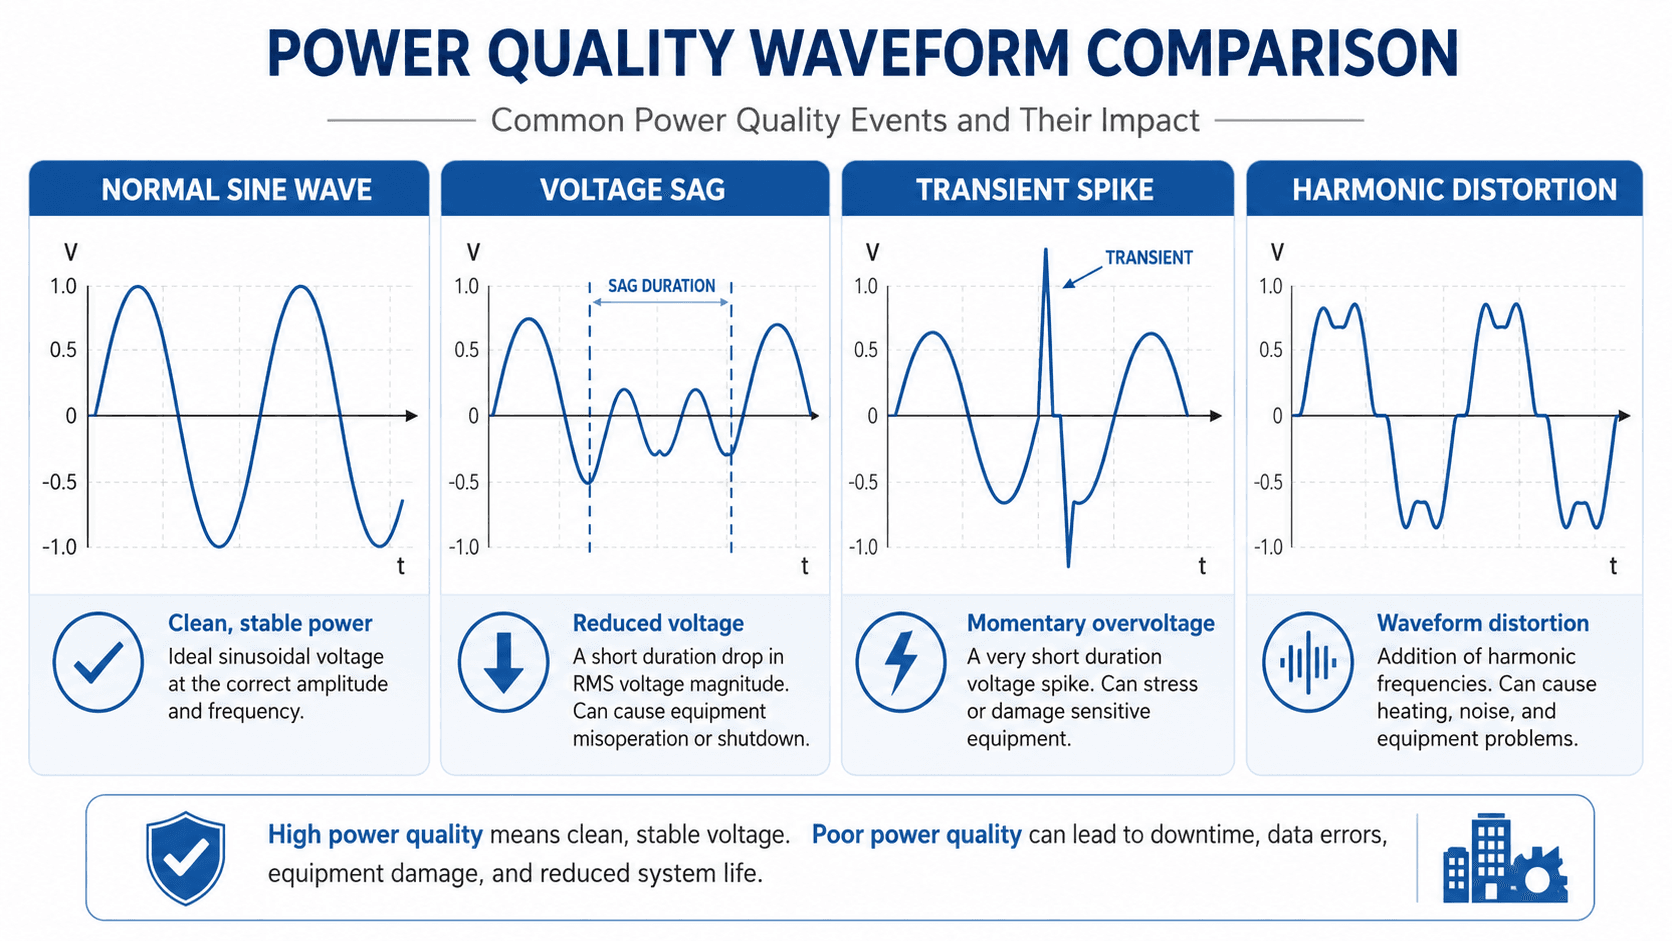
| Disturbance | What it is | Common symptoms | Typical causes |
|---|---|---|---|
| Voltage sag / dip | Short-duration decrease in RMS voltage | VFD trips, contactor dropout, PLC reset, light dimming | Faults, motor starting, large load changes, weak feeder |
| Voltage swell | Short-duration increase in RMS voltage | Overvoltage alarms, insulation/electronic stress | Load rejection, fault clearing, regulator switching |
| Interruption | Voltage falls to near zero | Equipment shutdown, process interruption, data loss | Breaker operation, utility outage, transfer event |
| Transient | Very fast impulsive or oscillatory voltage/current event | Electronic damage, nuisance alarms, insulation stress | Lightning, capacitor switching, load switching, fault clearing |
| Harmonic distortion | Waveform components at integer multiples of the fundamental | Transformer heating, neutral heating, nuisance trips, waveform distortion | VFDs, rectifiers, UPS systems, LED drivers, inverters |
| Flicker / rapid voltage change | Repeated voltage fluctuation that can affect lighting | Visible lamp flicker, customer complaints | Welders, cyclic loads, motor starts, weak source |
| Voltage unbalance | Unequal three-phase voltage magnitudes or phase relationships | Motor heating, reduced torque, vibration | Uneven single-phase loading, poor connections, feeder imbalance |
| Frequency variation | Deviation from nominal system frequency | Generator/motor alarms, control issues, island instability | Generation-load imbalance, islanding, major system disturbance |
Swipe horizontally to view all table columns.
“Voltage sag” and “voltage dip” are commonly used for the same basic phenomenon: a short-duration reduction in RMS voltage.
What Causes Poor Power Quality?
Poor power quality can originate upstream on the utility system, inside the facility, or at the affected equipment. The source should be identified from measurements rather than assumed from the symptom.
| Source | Typical disturbance | Engineering check |
|---|---|---|
| Utility feeder fault / switching | Sag, interruption, swell, transient | Compare service-entrance event timing with utility/feeder events |
| Large motor start | Sag, flicker | Starting current, transformer size, feeder impedance, control-power ride-through |
| VFD / rectifier / UPS | Current harmonics, notching, waveform distortion | Harmonic spectrum, loading, line reactors/filters, upstream impedance |
| Loose or high-resistance connection | Voltage drop, flicker, heating, intermittent events | Thermography, voltage drop under load, termination inspection |
| Grounding / bonding problem | Noise, unstable reference, sensitive-equipment errors | Bonding paths, neutral-ground relationships, equipment grounding conductor continuity |
| Solar / battery inverter | Voltage-control interaction, harmonics, rapid changes, ride-through issues | Inverter settings, grid strength, PCC measurements, event logs |
Swipe horizontally to view all table columns.
Harmonics, THD, and Waveform Distortion
Nonlinear loads draw non-sinusoidal current. That current interacts with system impedance and can distort voltage, heat equipment, overload neutrals, and create resonance or nuisance-operation problems.
Total Harmonic Distortion
- \(V_1\)RMS magnitude of the fundamental voltage component.
- \(V_2…V_n\)RMS magnitudes of higher-order harmonic components.
- THDTotal harmonic distortion relative to the fundamental.
Voltage THD vs. Current Distortion
Current distortion is primarily created by nonlinear loads; voltage distortion results from distorted current flowing through system impedance. A facility can therefore have high current distortion but relatively low voltage distortion when the source is stiff, or much worse voltage distortion when the same loads are connected to a weak source.
One THD percentage does not identify the root cause. Engineers review individual harmonic orders, current level, system impedance, resonance risk, operating state, and measurement location.
IEEE 519-2022 establishes harmonic design goals for systems with linear and nonlinear loads and applies steady-state voltage and current distortion limits at the point of common coupling: IEEE 519-2022.
How Power Quality Is Measured
Power quality is measured over time with equipment capable of recording RMS trends, disturbances, waveform data, harmonics, unbalance, frequency, and event timestamps.
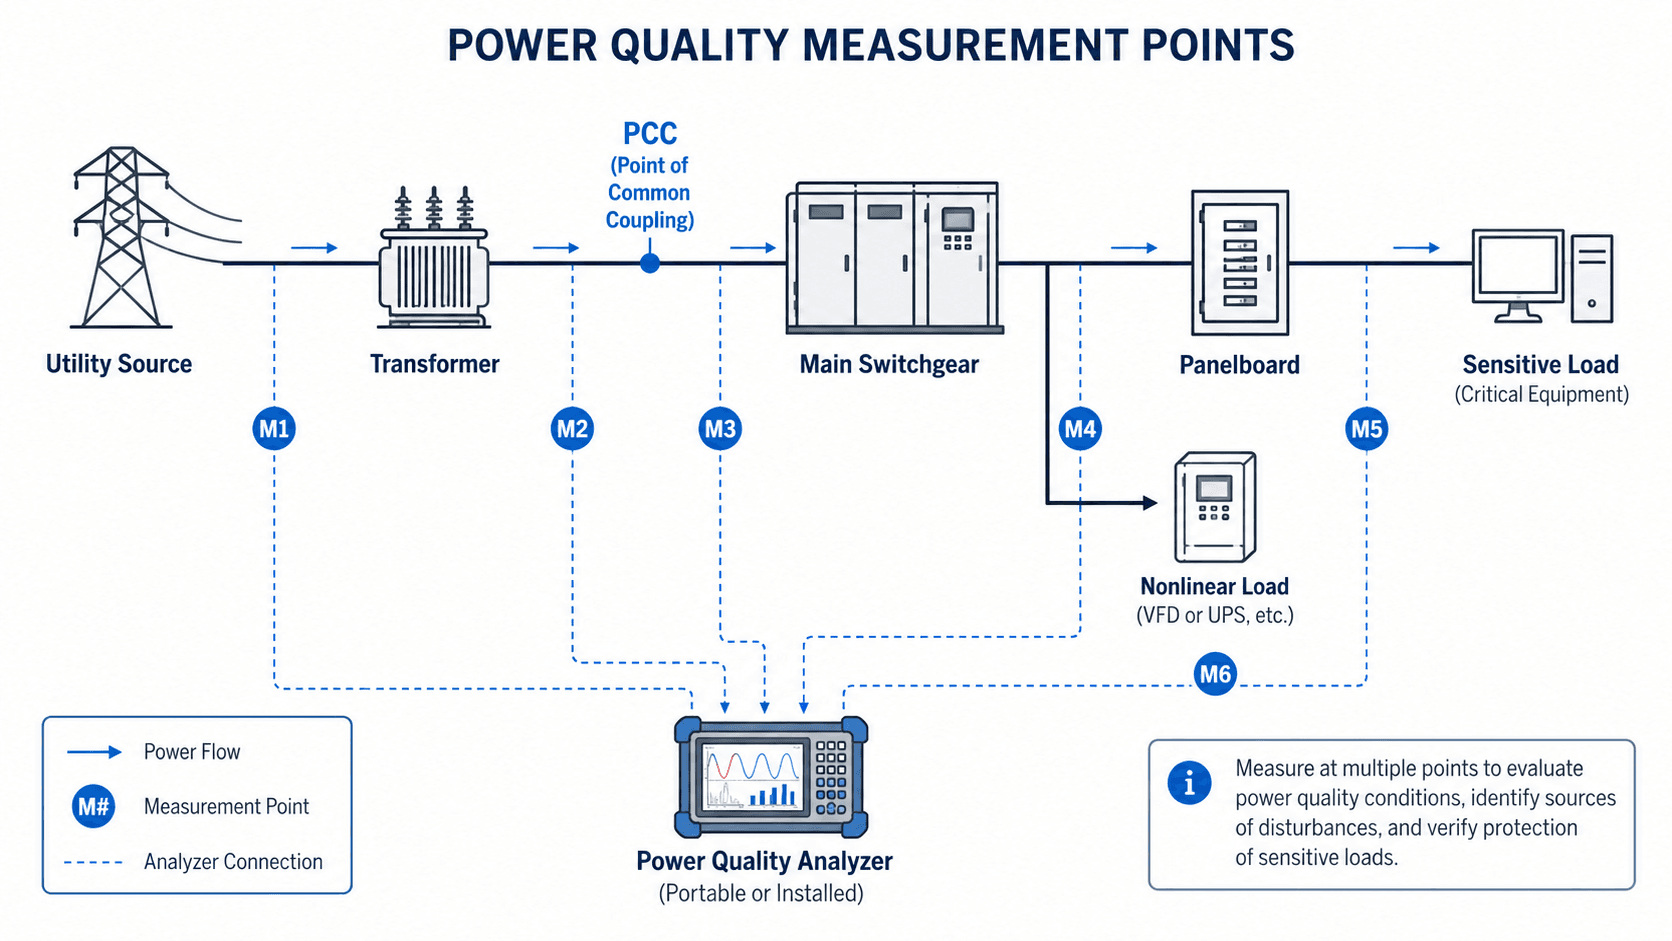
| Quantity | What it reveals |
|---|---|
| RMS voltage/current | Sags, swells, interruptions, sustained under/overvoltage, load changes |
| Frequency | Generation-load imbalance, island behavior, major system events |
| Waveform capture | Transients, notching, distortion, switching behavior |
| Harmonic spectrum / THD | Nonlinear load behavior and distortion by harmonic order |
| Voltage/current unbalance | Phase imbalance affecting motors and three-phase equipment |
| Flicker / rapid voltage change | Repeated fluctuations from cyclic or varying loads |
| Event timestamps | Correlation with equipment starts, trips, faults, transfers, and utility events |
Swipe horizontally to view all table columns.
Measurement Class Matters
For formal or comparative measurements, use instrumentation appropriate to the purpose. IEC 61000-4-30:2025 defines repeatable power-quality measurement methods and distinguishes Class A measurements from Class S survey measurements.
IEC 61000-4-30:2025 covers methods for measuring power frequency, supply-voltage magnitude, flicker, dips, swells, interruptions, transient voltages, unbalance, harmonics, interharmonics, rapid voltage changes, and related current quantities: IEC 61000-4-30:2025.
Monitoring must be long enough to capture the problem. A disturbance that occurs once per shift, during transfer, or only at high solar output can easily be missed by a short test.
Power Quality Troubleshooting Workflow
The strongest investigations connect symptoms to measured electrical events and operating conditions before any mitigation is selected.
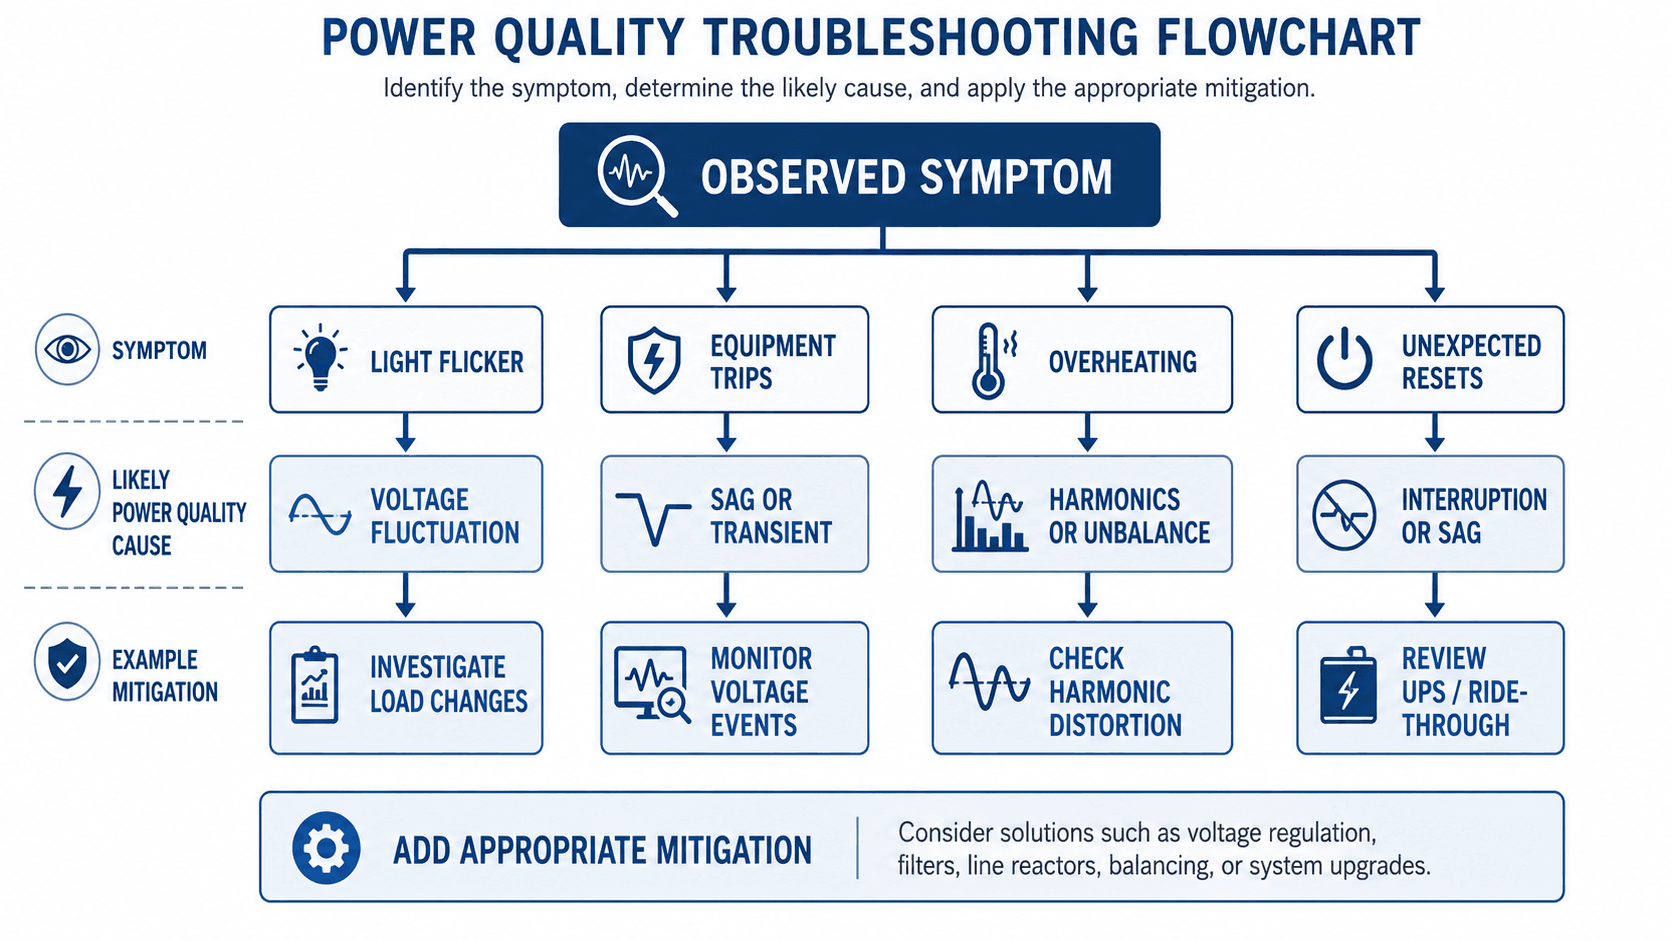
- Define the symptom.
Record exactly what trips, resets, flickers, overheats, or fails and when it happens.
- Choose measurement points.
Monitor the service entrance, affected feeder, nonlinear load, and sensitive equipment as needed.
- Capture the event.
Record RMS trends, waveforms, harmonics, unbalance, frequency, and timestamps.
- Correlate with operation.
Compare event time with motor starts, VFD ramps, inverter changes, switching, UPS transfer, storms, or utility events.
- Classify the disturbance.
Determine whether the issue is sag, swell, interruption, transient, harmonic distortion, flicker, unbalance, or another phenomenon.
- Apply and verify mitigation.
Correct the source or improve equipment immunity, then monitor again to confirm the problem is actually resolved.
Is the Problem Utility-Side, Facility-Side, or Equipment-Side?
The same symptom can have different causes. Comparing upstream and downstream measurements is often the fastest way to identify where the disturbance begins.
| Evidence | Likely interpretation |
|---|---|
| Same event appears at service and downstream loads | Likely upstream or system-wide disturbance |
| Event appears only after one panel/feeder | Likely local feeder, connection, or load interaction |
| Event aligns with local motor/VFD/UPS operation | Likely internally generated or amplified by local system impedance |
| Harmonics rise when nonlinear equipment operates | Likely nonlinear load contribution |
| Sensitive device resets while local voltage remains clean | Likely equipment immunity, control-power, grounding, or local noise issue |
Swipe horizontally to view all table columns.
Do not assign responsibility before the data supports it. A disturbance can originate upstream, be amplified by local impedance, and only affect the most sensitive equipment.
How Engineers Improve Power Quality
Power quality mitigation must match the actual disturbance. A UPS does not solve harmonic resonance, and a harmonic filter does not solve utility interruptions.
| Problem | Possible mitigation | What must be verified first |
|---|---|---|
| Sag / dip | UPS, ride-through, soft start, feeder reinforcement, load sequencing | Sag depth, duration, location, equipment immunity |
| Transient | SPD, surge arrester, improved bonding, switching coordination | Transient source, exposure path, protective level |
| Harmonics | Line reactor, passive/active filter, multi-pulse/low-harmonic equipment, system redesign | Harmonic spectrum, PCC limits, resonance, loading |
| Flicker | Reduce inrush, stiffen source, separate cyclic load, revise control strategy | Fluctuation source and system impedance |
| Voltage unbalance | Rebalance loads, repair connections, revise feeder loading | Phase voltage/current data and source condition |
| Sensitive-equipment resets | Dedicated control power, UPS, ride-through, wiring/grounding correction | Actual disturbance versus equipment tolerance |
Swipe horizontally to view all table columns.
Related system-level topics include Voltage Regulation, Grounding Techniques, and Surge Arresters.
Power Quality Field Review Checklist
A power quality investigation should connect the electrical data to the physical system and operating timeline.
| Review item | What to verify | Risk if missed |
|---|---|---|
| Symptom timeline | Exact timestamp, affected equipment, operating state | Electrical event cannot be correlated to plant/utility activity |
| Measurement point | Service, feeder, load, neutral, PCC, sensitive device terminals | Wrong conclusion about where the disturbance begins |
| Instrument capability | RMS events, waveform capture, harmonics, unbalance, transient bandwidth/class | Disturbance is missed or measured inconsistently |
| Nonlinear loads | VFD, UPS, rectifier, LED, EV charger, inverter operation | Internal harmonic source overlooked |
| Large/cyclic loads | Motor starts, welders, compressors, heaters, process cycles | Sag or flicker source overlooked |
| Grounding / bonding | Neutral-ground relationship, bonding, grounding conductors, noise paths | Reference/noise issue misdiagnosed as source voltage problem |
| Post-fix verification | Repeat monitoring after mitigation | Solution is assumed effective without evidence |
Swipe horizontally to view all table columns.
Do not choose the solution before identifying the disturbance. Measure first, classify the event, locate its source, then select mitigation.
Power Quality Engineering References
Power-quality standards help create consistent measurement, terminology, and distortion limits, but project-specific acceptance still depends on the utility, equipment sensitivity, facility requirements, and point of measurement.
- IEEE 519-2022 — Standard for Harmonic Control in Electric Power Systems Steady-state voltage and current distortion goals at the point of common coupling for systems with harmonic-producing loads.
- IEC 61000-4-30:2025 — Power Quality Measurement Methods Repeatable measurement methods for frequency, voltage magnitude, flicker, dips, swells, interruptions, transients, unbalance, harmonics, interharmonics, rapid voltage changes, and current quantities.
Frequently Asked Questions
What is power quality in electrical engineering?
Power quality describes whether the supplied voltage, frequency, and waveform are suitable for connected electrical equipment. Common problems include sags, swells, interruptions, transients, harmonics, flicker, and unbalance.
What are the most common power quality problems?
Common problems include voltage sags, swells, interruptions, transients, harmonic distortion, flicker, voltage unbalance, and frequency variation.
What causes poor power quality?
Causes include utility faults and switching, motor starts, nonlinear loads, VFDs, UPS systems, inverters, poor connections, grounding problems, overloaded circuits, and interaction between sensitive equipment and system impedance.
How do you measure power quality?
Power quality is measured with a power quality analyzer or monitoring system that records voltage, current, frequency, harmonics, unbalance, waveform events, transients, and timestamps over a long enough period to capture the problem.
Is power quality the same as power factor?
No. Power factor describes the relationship between real and apparent power, while power quality covers voltage magnitude, waveform distortion, transients, sags, swells, interruptions, flicker, unbalance, and other disturbances.
Can poor power quality damage equipment?
Yes. Transients can stress insulation and electronics, harmonics can overheat transformers and conductors, voltage sags can trip controls and drives, and voltage unbalance can overheat motors.
Summary and Next Step
Power quality is the condition of the electrical supply as experienced by connected equipment. Engineers evaluate magnitude, frequency, waveform shape, balance, harmonics, transients, and short-duration events rather than relying on one voltage reading.
The best investigations define the symptom, measure at useful locations, capture the disturbance, correlate it with system operation, determine whether the source is upstream or local, then apply and verify a targeted solution.