Key Takeaways
- Definition: A compaction test shows how soil dry density changes with moisture content so engineers can identify optimum moisture content and maximum dry density.
- Use case: It provides the laboratory benchmark used to write and enforce field density requirements for pads, embankments, trench backfill, and pavement subgrades.
- Main decision: The key judgment is whether Standard Proctor or Modified Proctor better represents the expected field compactive effort and project demands.
- Outcome: After reading, you should be able to interpret the compaction curve, understand percent compaction, and recognize when lab results do not fully represent field behavior.
Table of Contents
Introduction
In brief: A compaction test measures how densely a soil can be packed at different moisture contents so engineers can set realistic field compaction targets.
Who it’s for: Students, inspectors, and geotechnical designers.
If you work with engineered fill, subgrade preparation, trench backfill, or embankment construction, compaction testing is one of the clearest links between soil behavior in the lab and performance in the field.
Compaction Test infographic
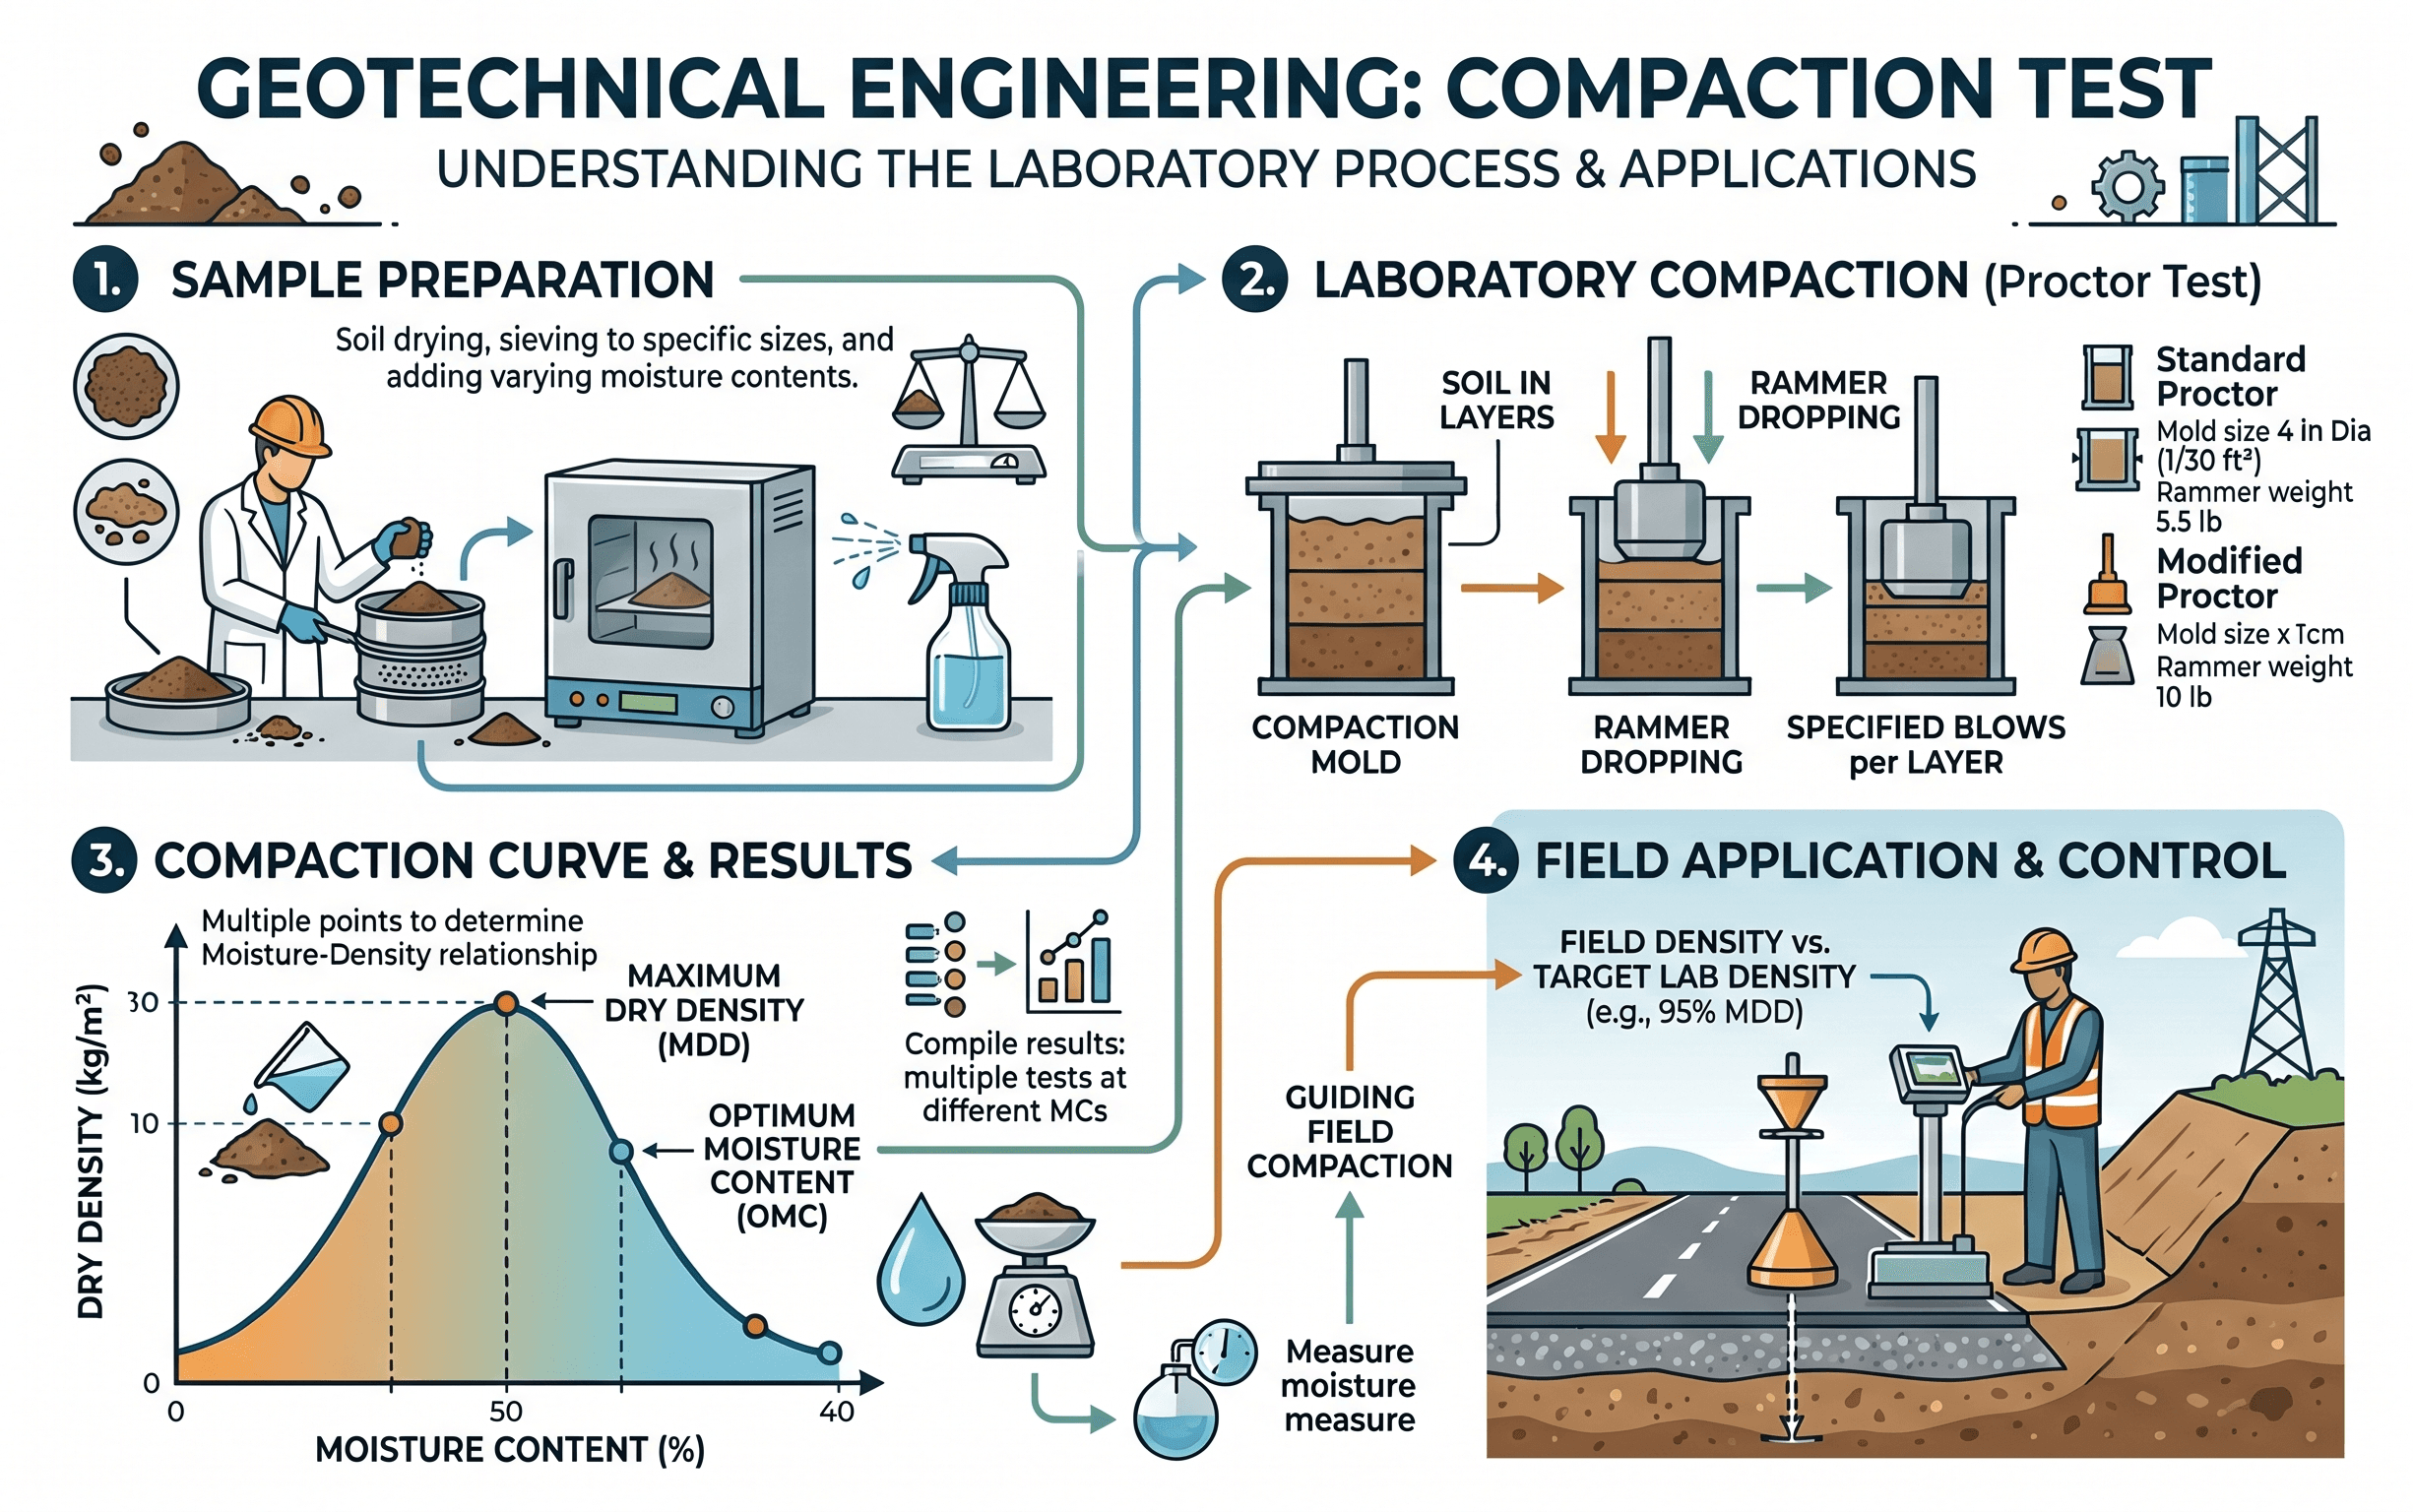
Notice the shape of the curve first. The left side represents soil that is too dry to compact efficiently, the peak identifies the best moisture condition for that compactive effort, and the right side shows how excess water lowers dry density even when the soil feels workable.
What is a compaction test?
A compaction test is a laboratory procedure used to determine how the dry density of a soil changes as its moisture content changes under a specified amount of compactive energy. In geotechnical practice, the output is usually a moisture-density curve that identifies two values engineers care about immediately: optimum moisture content and maximum dry density.
Those two values matter because construction specifications are rarely written as vague instructions like “compact the fill well.” Instead, they are written as measurable targets such as 95% of Standard Proctor or 98% of Modified Proctor within a defined moisture range. The compaction test supplies the reference line behind those acceptance criteria.
It also helps answer a deeper engineering question: how does a given soil respond to energy input? Granular soils, silts, and clays do not all compact the same way, and the compaction curve is one of the fastest ways to see that behavior in a form that can be used for earthwork control.
If you are building out your geotechnical fundamentals, this topic connects directly to Soil Mechanics, the more specific Standard Proctor Test, and broader fill performance guidance in Geotechnical Earthworks.
Core principles, variables, and units
Compaction is not the same thing as consolidation. Compaction is a rapid densification process caused mainly by reducing air voids through mechanical energy. Consolidation is a time-dependent volume change caused mainly by drainage and stress transfer in saturated soils. That distinction matters because a compaction test is about placement quality and workability, not long-term settlement by itself.
Why moisture changes compaction behavior
At low water contents, soil particles resist rearrangement because there is not enough water to reduce interparticle friction and soften the soil structure. As water is added, particles can move into a denser arrangement more easily, so dry density increases. But after a certain point, added water begins to occupy space that could otherwise be used by soil solids, and dry density falls. That turning point is the optimum moisture content.
Key variables and typical ranges
Most compaction discussions revolve around unit weight, dry density, water content, and percent compaction. In practice, values vary significantly with soil type, gradation, plasticity, and compactive effort, so use ranges only as rough intuition, not as universal truth.
- \(w\) Moisture content, usually reported as a percentage by dry mass. Fine-grained soils often show a wider practical moisture window than clean granular soils.
- \(\gamma\) Bulk or moist unit weight, often in pcf or kN/m³. This is the weight per total volume before correcting for moisture content.
- \(\gamma_d\) Dry unit weight or dry density, often in pcf or kN/m³. This is the value plotted against moisture content on the compaction curve.
- OMC Optimum moisture content, the water content at which maximum dry density is achieved for the specific test method and soil.
- MDD Maximum dry density, the peak of the laboratory compaction curve used as the field reference value.
- \(%C\) Percent compaction, the ratio of measured field dry density to laboratory maximum dry density, expressed as a percent.
Never discuss “95% compaction” without also stating the test basis. Ninety-five percent of Standard Proctor and ninety-five percent of Modified Proctor are not equivalent requirements.
Decision logic or design workflow
Engineers usually follow a consistent thought process when using compaction testing on a project. The test itself is only one step in a larger quality-control workflow that begins with soil identification and ends with field acceptance.
Step 1: Identify the material. Classify the soil and decide whether the sampled material is representative of the fill that will actually be placed.
Step 2: Select the compaction standard. Use Standard Proctor for many general fills and sitework applications; use Modified Proctor where loading, pavement demand, or agency requirements call for higher compactive effort.
Step 3: Run the lab test. Prepare specimens at several water contents, compact each one under the prescribed method, and compute dry density.
Step 4: Plot the curve. Identify OMC and MDD, then establish the target field acceptance criteria.
Step 5: Verify in the field. Compare nuclear gauge, sand cone, or other field density results to the lab-derived benchmark and adjust moisture, lift thickness, or equipment if needed.
The most important judgment call is often not a calculation. It is deciding whether the soil tested in the lab actually represents what the contractor is placing in the field. If the borrow source changes, the gradation changes, or organics and oversize particles appear, the original benchmark can become misleading very quickly.
Equations and calculations
The two calculations most readers need are the conversion from moist unit weight to dry unit weight and the percent compaction comparison between field and lab results.
In this expression, \(\gamma_d\) is dry unit weight, \(\gamma\) is moist unit weight, and \(w\) is moisture content expressed as a decimal. This equation is used for each compaction specimen so the moisture-density curve reflects dry density rather than wet weight.
Percent compaction compares the measured field dry density to the maximum dry density from the laboratory compaction curve. Specifications then define the minimum acceptable value, often with a moisture tolerance around optimum.
Keep units consistent from start to finish. If lab MDD is in pcf and the field test is reported in kN/m³, convert before judging compliance.
Worked example
Example
Assume a clayey sand fill is tested in the lab using the Standard Proctor method. The moisture-density curve peaks at an optimum moisture content of 11% and a maximum dry density of 118 pcf. The project specification requires at least 95% of Standard Proctor.
A field technician then measures a field dry density of 113 pcf at a moisture content of 10.5%. Percent compaction is:
The density requirement is met because 95.8% exceeds the 95% minimum. The moisture content is also near optimum, which is encouraging because soils compacted far dry of optimum or far wet of optimum may behave differently even if density looks acceptable on paper.
That last point is often missed. Two fills can achieve similar percent compaction and still perform differently because one was placed too dry and one too wet. Strength, shrink-swell response, permeability, and rutting sensitivity may not be equivalent. This is why good specifications often include both density and moisture criteria.
Engineering judgment and field reality
Compaction testing looks clean in the laboratory, but field earthwork is rarely that clean. Soil type may vary across the site, weather may shift moisture conditions hour by hour, and equipment performance may change with lift thickness, operator behavior, and production pressure.
Experienced engineers know that compaction is controlled by more than just the target number. Material uniformity, moisture conditioning time, clod breakdown, equipment type, number of passes, and layer thickness all change the outcome. A specification that says “98%” is only useful if the field process can realistically achieve it for that soil.
Fine-grained soils are a common source of confusion. A cohesive soil may show strong density near optimum but still become unstable under proof rolling if it is too wet and loses strength under traffic. Conversely, a soil compacted slightly dry of optimum may be stiffer initially but more vulnerable to later wetting, shrinkage cracking, or difficulty in achieving uniform bonding between lifts.
The lab curve does not guarantee field success. It only defines the benchmark for a specific soil and compactive effort. If placement conditions change, the benchmark may still be mathematically correct but practically incomplete.
On larger projects, it is often worth pairing compaction data with broader earthwork judgment. That may include borrow management, proof rolling, undercut criteria, stabilization plans, or even ground improvement when subgrades are too weak for traffic despite nominal density compliance. For that reason, compaction testing often sits alongside topics like Ground Improvement and Geosynthetics in real project decisions.
When this breaks down
A compaction test stops being a reliable guide when its assumptions no longer match site reality. One common breakdown occurs when the tested soil is not representative of the actual placed material. Another occurs when oversize particles or mixed materials dominate the field condition but were excluded or minimized in the lab sample.
The method also becomes less useful when field loading and performance concerns are governed more by shear strength, rutting resistance, pumping, or saturation sensitivity than by dry density alone. In those cases, density is still relevant, but it may not be the controlling variable.
There are also limits tied to soil type. Clean, free-draining granular materials can be difficult to characterize with the same clarity as plastic fines-rich soils because moisture effects and field response may differ from what readers expect from a smooth textbook compaction curve. Likewise, highly organic soils, collapsible soils, and unstable fills may show that achieving density does not solve the underlying suitability problem.
In short, a compaction test is a strong control tool, but it is not a universal predictor of long-term performance, constructability, or serviceability.
Common pitfalls and engineering checks
- Using the wrong Proctor standard for the project and then writing misleading field requirements.
- Assuming all material from a borrow area behaves like the original tested sample.
- Ignoring moisture tolerance and focusing only on percent compaction.
- Testing density on lifts that are thicker than the compaction equipment can densify effectively.
- Overlooking that a passing density result can still coexist with poor proof-roll performance or weak subgrade behavior.
One of the costliest mistakes is treating percent compaction as the whole specification. On many projects, the real question is not only “Did it hit 95%?” but also “Was it compacted at the right moisture and does it actually support construction traffic and long-term performance?”
| Parameter | Symbol | Typical units | Notes |
|---|---|---|---|
| Moisture content | \(w\) | % | Should usually be evaluated relative to optimum, not in isolation. |
| Dry unit weight | \(\gamma_d\) | pcf or kN/m³ | The key value plotted on the compaction curve. |
| Maximum dry density | MDD | pcf or kN/m³ | Laboratory peak value used for comparison in specifications. |
| Optimum moisture content | OMC | % | Depends on soil type and compactive effort; not a universal property. |
| Percent compaction | \(%C\) | % | Field dry density divided by lab MDD times 100. |
Visualizing the compaction curve in practice
A useful mental model is to divide the compaction curve into three zones. On the dry side of optimum, the soil is too stiff and harsh to rearrange efficiently. Near optimum, the material is usually easiest to densify and most likely to produce uniform field results. On the wet side of optimum, the soil may feel workable but added water begins to reduce achievable dry density.
That visual framing helps during field troubleshooting. If a crew is repeatedly failing density while the soil is visibly dusty and difficult to blade, the problem may be that the material is too dry. If the soil is pumping, rutting, or squeezing under equipment, the issue may be excess moisture even if some density numbers still look acceptable.
In other words, the curve is not just a lab plot. It is a fast way to think about what the field crew is seeing and why adjustments to water, lift thickness, or equipment passes may be necessary.
Relevant standards and design references
Compaction testing sits at the intersection of laboratory soil testing, field verification, and project-specific earthwork specifications. These are some of the most relevant references to keep in view.
- ASTM D698: Standard Proctor compaction test. Common for general fills, building pads, and many standard earthwork applications.
- ASTM D1557: Modified Proctor compaction test. Used where higher compactive effort better represents field conditions or where specifications are more demanding, such as pavements and heavily loaded areas.
- ASTM D2216: Moisture content determination of soils by mass. Supports the water-content side of the moisture-density relationship.
- ASTM D6938: In-place density and moisture content by nuclear methods. Common field verification method for comparing actual placed fill to the lab benchmark.
- ASTM D1556: Sand cone field density test. Often used as an alternate or check method where nuclear gauge data needs confirmation.
Frequently asked questions
A compaction test is usually a laboratory test that establishes the moisture-density curve, optimum moisture content, and maximum dry density for a soil under a defined compactive effort. Field density testing checks whether the soil actually placed on the project meets the required percentage of that laboratory benchmark.
Standard Proctor uses lower compactive effort and is common for many general fills and sitework specifications, while Modified Proctor uses higher effort and usually produces a higher maximum dry density and lower optimum moisture content. The correct choice depends on the project requirements, expected field equipment, and governing agency or design standard.
Moisture content changes how easily soil particles can move into a denser arrangement when energy is applied. Too little water leaves the soil resistant to compaction, while too much water fills space and lowers achievable dry density even if the soil looks easier to manipulate.
It becomes less reliable when the field material is no longer representative of the tested sample, when oversize particles or mixed borrow dominate, or when density alone is no longer the controlling performance issue. In those cases, the test still provides useful information, but engineering judgment and supplemental evaluation become more important.
Summary and next steps
A compaction test is one of the most practical laboratory tools in geotechnical engineering because it turns a vague construction goal into measurable values: optimum moisture content, maximum dry density, and percent compaction targets. For fills, subgrades, embankments, and backfill, that makes it a core bridge between design intent and field quality control.
The main lesson is that density is important, but density alone is not the entire story. Engineers still need to check whether the tested soil is representative, whether the selected Proctor method matches project demands, and whether field moisture, equipment, and lift thickness are producing real performance rather than just passing numbers.
As you go deeper, connect compaction testing to soil behavior, earthwork specifications, and field constructability. That is where the topic becomes genuinely useful rather than just procedural.
Where to go next
Continue your learning path with these curated next steps.
-
Read a deeper dive on the Standard Proctor Test
A more focused guide on the classic laboratory method behind many fill and sitework specifications.
-
Study Soil Mechanics
Useful for understanding why density, water content, void ratio, and effective stress matter beyond the test result itself.
-
See how compaction fits into geotechnical earthworks
A practical next step for connecting lab targets to fill placement, proof rolling, drainage, and construction quality.