Key Takeaways
- Core idea: Geotechnical data analysis turns raw subsurface information into interpreted soil and rock profiles, groundwater assumptions, and design-ready parameters.
- Engineering use: The analysis supports foundation design, settlement review, slope stability, retaining wall inputs, excavation planning, earthwork control, and ground improvement decisions.
- What controls it: Data quality, boring coverage, sample disturbance, groundwater behavior, field/lab consistency, spatial variability, and project risk control the reliability of the interpretation.
- Practical check: Never treat a subsurface model as a perfect picture of the ground; it is an engineering interpretation that must be checked against uncertainty and field conditions.
Table of Contents
Introduction
Geotechnical data analysis is the process of checking, organizing, interpreting, and applying soil, rock, groundwater, field, laboratory, and monitoring data so engineers can build defensible subsurface models and select design parameters for foundations, slopes, retaining systems, excavations, earthworks, and ground improvement.
How Geotechnical Data Becomes an Engineering Decision
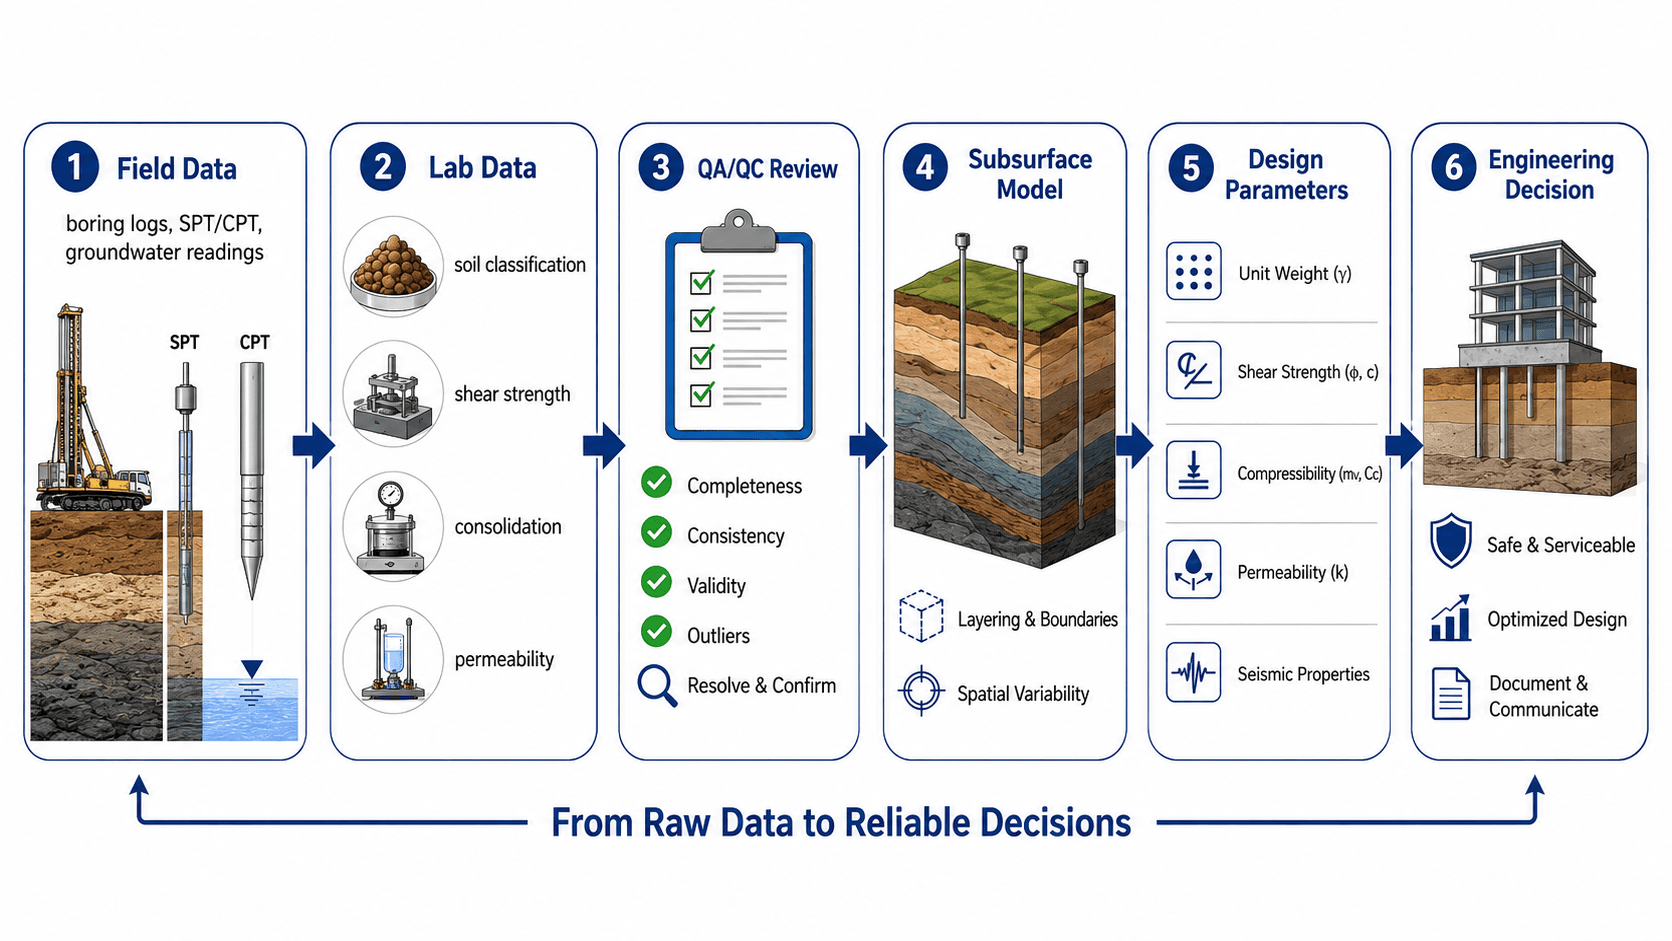
Notice the middle of the workflow: raw data does not automatically become a design value. It must be checked for quality, consistency, uncertainty, and relevance to the actual design problem.
What is Geotechnical Data Analysis?
Geotechnical data analysis is the engineering interpretation step between site investigation and design. It starts with measured or observed information such as boring logs, SPT blow counts, CPT soundings, groundwater readings, laboratory tests, rock core logs, and field observations. The goal is to determine what the ground is likely to do when it is loaded, excavated, saturated, compacted, drained, or left in service.
The output is not just a spreadsheet of test values. A useful analysis produces an interpreted subsurface profile, design groundwater assumptions, soil and rock parameter ranges, construction considerations, and risk flags. Those outputs support downstream topics such as foundation design, settlement analysis, retaining wall design, earthworks, and slope-related decisions.
Geotechnical data is evidence. Geotechnical analysis is the engineering judgment that turns that evidence into a model, parameter set, and recommendation that can be defended.
Types of Geotechnical Data Engineers Analyze
Most geotechnical projects combine several data sources because no single test fully describes the ground. A boring log may show soil layering, but it does not fully define strength. A lab test may measure a sample precisely, but the sample may not represent the controlling field condition. Good analysis compares multiple lines of evidence.
| Data source | What it helps identify | What engineers must check |
|---|---|---|
| Boring logs and test pits | Soil and rock layers, fill depth, sample recovery, visual classification, and groundwater encountered during exploration | Whether exploration depth, spacing, and logging detail match the project risk and influence zone |
| SPT and CPT data | Relative density, consistency, stratigraphy, penetration resistance, and correlation-based engineering properties | Energy correction, refusal, disturbed zones, correlation limits, and whether trends agree with observed soil behavior |
| Laboratory classification tests | Gradation, Atterberg limits, water content, unit weight, plasticity, and material grouping | Sample disturbance, moisture change, representativeness, and consistency with field descriptions |
| Strength and compressibility tests | Shear strength, consolidation behavior, compressibility, stiffness, and deformation potential | Drainage condition, stress level, sample quality, strain rate, and whether the test condition matches the design case |
| Groundwater readings | Water table, perched water, pore pressure trends, seepage risk, and excavation or slope sensitivity | Whether readings are initial, stabilized, seasonal, delayed, or affected by drilling method |
| Instrumentation and construction observations | Settlement, lateral movement, pore pressure response, excavation behavior, and real performance feedback | Whether monitoring confirms, contradicts, or updates the original design assumptions |
This is why soil testing and soil mechanics sit directly upstream of data analysis. Testing produces measured properties, while soil mechanics explains what those properties mean under load, water, and time.
How Boring Logs, SPT, and CPT Data Are Interpreted Together
Boring logs, SPT results, and CPT soundings are often reviewed together because each one tells a different part of the story. A boring log provides visual descriptions and samples. SPT data provides discrete penetration resistance values. CPT data provides a more continuous resistance profile. The strongest interpretation looks for agreement between the three instead of relying on one source alone.
| Data item | What it suggests | What to be careful about |
|---|---|---|
| Soil description | Layer type, color, moisture, texture, plasticity, fill, organic content, and likely behavior | Descriptions can vary by logger, sample quality, recovery, and field conditions during drilling. |
| SPT N-value | Relative density in sands, consistency in clays, penetration resistance, and changes with depth | Energy correction, sampler type, gravel, drilling disturbance, and refusal conditions can affect the value. |
| CPT profile | Continuous resistance trends, soil behavior type, thin layers, and changes between borings | CPT correlations still need engineering judgment and should be checked against samples, geology, and groundwater. |
| Groundwater observation | Water level, seepage condition, perched water, or delayed stabilization potential | One-time readings during drilling may not represent seasonal high groundwater or long-term pore pressure. |
| Sample recovery | Continuity of material, quality of sampled interval, and reliability of lab testing | Poor recovery may hide weak seams, gravel zones, voids, soft pockets, or disturbed material. |
If the boring log says soft clay, the SPT data should generally show low resistance, lab water contents may be elevated, and consolidation behavior may be important. When those clues disagree, the disagreement is part of the analysis.
Factual Data vs. Interpreted Geotechnical Parameters
One of the most important skills in geotechnical data analysis is separating factual information from interpretation. Factual data is what was observed, measured, logged, or tested. Interpretive information is the engineer’s conclusion based on that evidence.
| Category | Examples | Why the distinction matters |
|---|---|---|
| Factual data | SPT N = 12 at 15 ft, groundwater encountered at 11 ft, water content = 24%, clay described from 10 to 18 ft | These are observations and measurements that should remain traceable to logs, lab reports, or monitoring records. |
| Interpreted profile | Medium stiff clay layer from 10 to 20 ft, loose sand lens near BH-3, weathered rock surface sloping across the site | These are engineering approximations that connect discrete data points into a usable site model. |
| Design parameters | Selected unit weight, undrained shear strength, friction angle, compressibility, permeability, modulus, and design groundwater level | These values directly affect design checks and should be chosen with awareness of uncertainty, project risk, and analysis sensitivity. |
| Recommendations | Shallow foundations acceptable, additional settlement review required, undercut soft fill, use deep foundations, monitor groundwater | Recommendations depend on both data and judgment; they should not be copied without understanding the assumptions behind them. |
A strong geotechnical report should make this distinction clear. Readers should be able to trace how factual data led to the interpreted model, how the model led to selected parameters, and how those parameters led to design recommendations.
A boring log is not a continuous slice through the ground. It is a vertical record at one location. The interpreted profile between borings is a reasoned engineering model, not a guaranteed boundary.
Step-by-Step Geotechnical Data Analysis Workflow
A strong analysis workflow moves from completeness to interpretation to design relevance. The order matters because selecting design parameters before checking data quality can create false confidence in numbers that are not representative.
1. Organize field, lab, and groundwater records
Start by grouping boring logs, sample records, lab reports, field test results, groundwater observations, and construction or monitoring data by location and depth. This makes it easier to compare trends across the site instead of treating each result as an isolated number.
2. Check quality before interpreting trends
Review sample condition, missing intervals, inconsistent classifications, questionable groundwater readings, unusual blow counts, and lab values that do not match visual descriptions. A technically precise test result can still be misleading if the sample was disturbed or not representative.
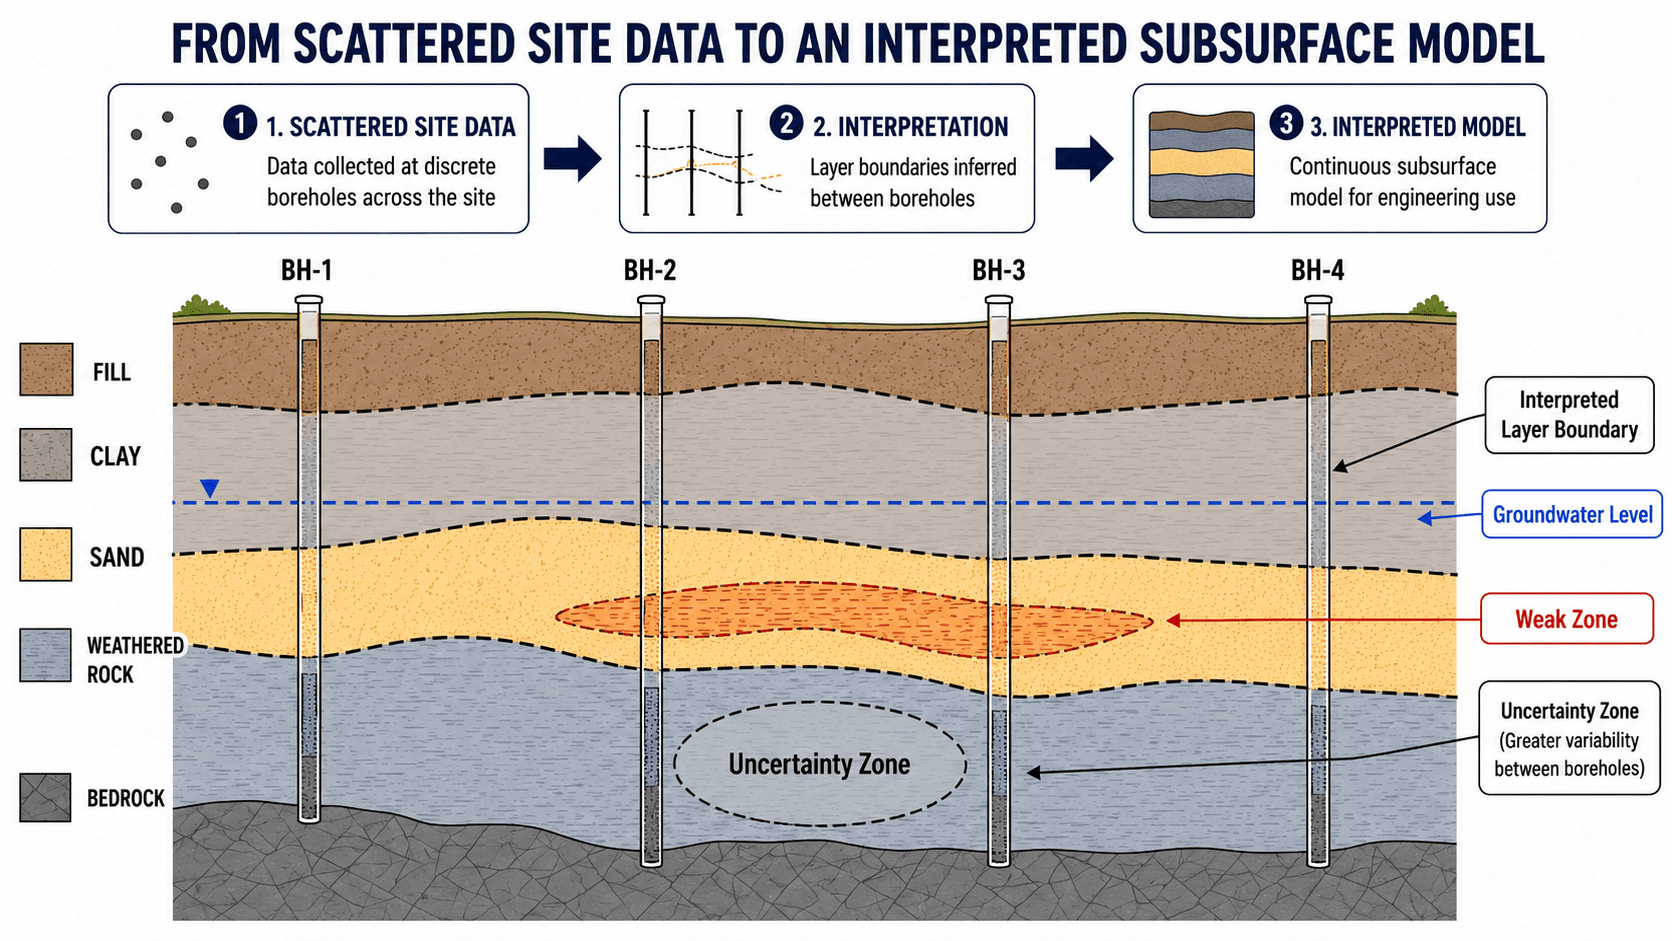
3. Build an interpreted subsurface model
Use the evidence to define likely layers, groundwater conditions, weak zones, fill limits, weathered rock surfaces, and zones of uncertainty. The model should be detailed enough to support design but honest about where the data is sparse.
The most common mistake in reading subsurface data is assuming layer boundaries are known continuously across the site. In reality, those boundaries are inferred between borings and should be treated with more caution where the spacing is wide or the geology is variable.
4. Select design parameters for the actual problem
Choose strength, compressibility, permeability, unit weight, modulus, and groundwater assumptions based on the controlling design condition. The right parameter for a temporary excavation may not be the right parameter for long-term settlement or lateral earth pressure.
5. Document assumptions, uncertainty, and design sensitivity
The final analysis should make clear which data controlled the interpretation, which assumptions were conservative, where uncertainty remains, and which design decisions are most sensitive to parameter changes.
How Engineers Analyze Trends, Scatter, and Outliers in Geotechnical Data
Real geotechnical data is rarely smooth. SPT values jump, CPT traces change quickly, lab results scatter, groundwater readings vary, and soil boundaries shift between borings. The job of analysis is not to erase that messiness. The job is to decide what the scatter means for the project.
Trends are usually more important than single values
Engineers compare data by depth, elevation, layer, and location. A single low SPT value may be less important if it is isolated and unsupported by other evidence. The same value becomes more important if nearby borings, CPT data, samples, or lab tests show a consistent weak zone.
Outliers are not automatically errors
An outlier may be a test problem, but it can also represent gravel, cemented material, fill, organic soil, a soft seam, a weathered rock pocket, or a localized construction risk. Discarding it without investigation can remove the most important data point in the dataset.
Averages can hide controlling conditions
Averaging all results in a layer may produce a value that looks statistically clean but ignores the weak portion that controls settlement, bearing, slope stability, or excavation performance. In geotechnical work, lower-bound behavior, characteristic values, and design sensitivity often matter more than a simple average.
Before averaging values, ask whether the data belongs to the same material, stress condition, groundwater condition, and design problem. If not, separate the data into meaningful engineering zones first.
How Data Becomes Design Parameters
Design parameters are selected values used in calculations, models, and recommendations. They are not simply copied from the highest, lowest, or most recent test result. Engineers usually evaluate ranges, data quality, correlations, field observations, and project consequences before choosing values.
| Design parameter | Typical data sources | Engineering implication |
|---|---|---|
| Unit weight | Moisture-density tests, lab measurements, soil classification, field judgment | Affects overburden stress, lateral earth pressure, bearing checks, and slope calculations. |
| Shear strength | SPT/CPT correlations, direct shear, triaxial tests, unconfined compression, vane shear | Controls bearing capacity, slope stability, retaining pressure assumptions, and excavation stability. |
| Compressibility | Consolidation tests, index properties, stress history, local experience | Controls total settlement, differential settlement, time rate of movement, and foundation selection. |
| Permeability | Lab permeability tests, gradation, field pumping response, piezometer behavior | Controls seepage, drainage, dewatering feasibility, uplift risk, and consolidation timing. |
| Groundwater level | Drilling observations, piezometers, seasonal records, site drainage context | Changes effective stress, excavation behavior, buoyancy, seepage forces, and long-term durability assumptions. |
| Rock quality and weathering | Core recovery, RQD, visual logging, strength tests, discontinuity observations | Affects drilled shaft design, rock socket assumptions, excavation methods, and bearing resistance. |
Before accepting a design value, ask what decision it controls. A conservative value for bearing capacity may not be conservative for settlement, seepage, lateral movement, or construction sequencing.
Data Quality Flags That Should Trigger a Second Look
Data quality review should identify conditions that may change the interpretation. A red flag does not automatically mean the data is wrong, but it does mean the engineer should pause before relying on it for design.
| Warning sign | What it may indicate | What to do next |
|---|---|---|
| Sudden SPT change not matching the soil description | Gravel, obstruction, sampler disturbance, drilling issue, or a real dense or weak zone | Compare sample recovery, nearby borings, CPT trends, and the drilling notes before accepting the value. |
| Lab strength much lower than field trend | Sample disturbance, sensitive clay, improper handling, or a real weak layer | Review sample quality, test method, water content, and whether the sample represents the design zone. |
| Groundwater only noted during drilling | The reading may not be stabilized and may not represent the long-term or seasonal condition | Look for delayed readings, piezometer records, drainage context, and signs of perched water. |
| One boring shows fill much deeper than others | Localized undocumented fill, buried feature, former excavation, or site grading variation | Flag the area as an uncertainty zone and consider targeted exploration if it affects design. |
| Layer boundary inferred far from borings | Overconfident interpolation between limited data points | Show uncertainty in the model and avoid treating the boundary as exact in sensitive design areas. |
Senior Engineer Review Checklist for Geotechnical Data
A strong data review asks whether the evidence is reliable enough for design, not just whether all the report sections are present. The checklist below helps identify whether additional investigation, testing, monitoring, or sensitivity analysis is needed.

| Review check | What to look for | Why it matters |
|---|---|---|
| Boring coverage | Borings extend deep enough and are spaced appropriately for structure loads, excavation depth, slope geometry, or fill thickness. | Too little exploration can miss weak layers, variable fill, soft pockets, or rock elevation changes. |
| Sample quality | Samples are labeled, preserved, and suitable for the intended lab tests; disturbed samples are not treated like undisturbed specimens. | Sample disturbance can distort strength, compressibility, moisture content, and classification. |
| Groundwater interpretation | Readings distinguish between drilling water, initial seepage, stabilized level, perched water, and seasonal variation. | Groundwater assumptions can govern effective stress, excavation support, seepage, uplift, and wall pressures. |
| Field/lab consistency | Lab classifications and measured properties make sense when compared with boring descriptions, SPT/CPT trends, and site geology. | Conflicting data may indicate sampling error, logging differences, local variability, or a missed soil behavior issue. |
| Parameter range | Selected values fall within reasonable ranges for the soil or rock type and are justified when they do not. | False precision can make a model look stronger than the data actually supports. |
| Outlier handling | Unusual values are investigated before being discarded or accepted. | Outliers may be test errors, but they may also identify the weak layer or anomaly that controls risk. |
| Traceability | Design assumptions can be traced back to boring logs, lab results, field measurements, monitoring records, or documented judgment. | Traceable assumptions make the analysis easier to review, update, and defend during design or construction. |
Example: Turning Boring and Lab Data Into a Design Interpretation
Consider a small building site with four borings across the footprint. The borings show 3 to 6 ft of variable fill over clay, a sand layer below the clay, and groundwater observed between 12 and 15 ft. Two borings also show a loose sand lens with lower penetration resistance than nearby locations.
Data interpretation
The engineer would not simply average all values across the site. The fill would be treated as a separate material because it may be uncontrolled. The clay layer would be reviewed for settlement potential using water content, index tests, and consolidation data. The loose sand lens would be flagged as a possible weak or variable zone, especially if it lies below heavily loaded columns.
Engineering meaning
The interpretation may lead to shallow foundations with settlement checks, selective undercutting of poor fill, additional borings near heavy loads, or a recommendation to evaluate ground improvement. Groundwater would also affect excavation planning and the assumptions used for effective stress, seepage, and construction staging.
A good interpretation connects data to decisions. The value is not only identifying the soil layers; it is identifying which layers can control cost, movement, constructability, or risk.
Software, Spreadsheets, and Databases in Geotechnical Data Analysis
Digital tools can make geotechnical data easier to manage, plot, compare, and review. Spreadsheets are often used for quick comparisons, parameter summaries, and simple plots. CAD, GIS, and modeling tools help relate boring locations to site geometry. Dedicated geotechnical software and databases help manage logs, lab results, cross sections, and monitoring data.
Software improves organization, but it does not replace interpretation. A clean database can still contain poor samples, unstable groundwater readings, wrong units, missing metadata, or overconfident layer boundaries. The engineer still has to decide whether the data is reliable enough for the design problem.
- Spreadsheets: Useful for parameter tables, outlier checks, summary statistics, and plotting test results by depth or layer.
- GIS and CAD: Useful for comparing boring locations, structure footprints, slopes, utilities, drainage patterns, and cross-section alignments.
- Geotechnical databases: Useful for storing boring logs, lab data, metadata, test results, and project history in a traceable format.
- Monitoring dashboards: Useful for reviewing settlement, pore pressure, inclinometers, and construction-stage performance trends.
A separate geotechnical software workflow may be useful when projects involve many borings, large datasets, repeated reporting, complex cross sections, or long-term instrumentation.
Where Geotechnical Data Analysis Changes Design Decisions
Geotechnical data analysis is most valuable when it changes a design choice, construction plan, or risk response. The same dataset may be interpreted differently depending on whether the project is controlled by bearing, settlement, excavation stability, seepage, slope movement, or constructability.
- Foundation selection: Data may show whether shallow foundations are feasible or whether deep foundations, ground improvement, or a mat foundation should be evaluated.
- Settlement control: Compressibility data and soft-layer thickness determine whether movement is tolerable or whether preload, removal, replacement, or ground improvement is needed.
- Retaining and excavation systems: Strength, groundwater, and soil layering affect earth pressure assumptions, drainage details, temporary support requirements, and movement risk.
- Earthwork and subgrade decisions: Classification, moisture-density behavior, organic content, and field proofing influence whether soil is reusable, needs conditioning, or should be undercut.
- Monitoring and observational updates: Settlement points, piezometers, and inclinometers help confirm whether the original model is performing as expected.
The best analysis does not ask, “What value did the test produce?” It asks, “Which ground behavior controls the project, and does this data actually represent that behavior?”
Engineering Judgment and Field Reality
Geotechnical data analysis is judgment-heavy because soil and rock are natural materials. A boring may miss a buried channel, fill lens, perched water condition, weathered seam, or soft pocket. A lab result may be accurate for the tested specimen but not representative of the controlling field zone.
Experienced engineers look for agreement between independent clues. A soft clay layer should make sense in the boring description, index tests, water content, strength data, consolidation response, and site geology. If those clues disagree, the answer is not to blindly average the numbers; it is to understand why the evidence conflicts.
When excavated soil, groundwater seepage, proof rolling, or instrumentation does not match the report assumptions, the model should be revisited. Construction observations are not background noise; they are new data.
When This Breaks Down
Geotechnical data analysis becomes unreliable when the model becomes more detailed than the data can justify. The risk is not only a wrong calculation; it is a confident design built on weak assumptions. This is where geotechnical risk assessment becomes important.
- Sparse exploration: Widely spaced borings may miss localized soft zones, undocumented fill, variable rock elevation, buried debris, or groundwater changes.
- Poor sample quality: Disturbed or dried samples can produce misleading strength, compressibility, and moisture-related results.
- Unstable groundwater assumptions: One-time readings may not represent seasonal highs, perched water, delayed stabilization, or construction-period seepage.
- Misused correlations: SPT, CPT, and index-property correlations are useful screening tools, but they are not substitutes for judgment and project-specific validation.
- Unclear design objective: A parameter chosen for short-term undrained strength may not be appropriate for long-term drained performance, settlement, or seepage.
Common Geotechnical Data Analysis Mistakes
Most interpretation errors come from treating geotechnical data as more certain, more continuous, or more transferable than it really is. A clean table of numbers can hide weak sampling, inconsistent assumptions, or a site model that does not match field behavior.
| Mistake | Why it creates risk | Practical check |
|---|---|---|
| Using one boring as the whole site model | Localized conditions may not represent the structure footprint, slope, wall alignment, or excavation area. | Compare all explorations and flag zones where layering or groundwater varies significantly. |
| Ignoring groundwater uncertainty | Water can change effective stress, seepage, uplift, excavation stability, and lateral earth pressures. | Separate initial, stabilized, perched, and seasonal groundwater assumptions. |
| Discarding outliers too quickly | The unusual result may identify the weak zone that controls settlement, bearing, or slope stability. | Investigate whether the outlier is a test issue, sample issue, or real subsurface variability. |
| Copying parameters between analysis cases | A value suitable for one condition may be inappropriate for another drainage state, load path, or time frame. | Match parameters to the design problem: short-term, long-term, drained, undrained, static, seismic, or construction-stage. |
| Treating the interpreted profile as exact | Layer boundaries between borings are inferred and may shift during construction. | Show uncertainty zones and identify what field observations should trigger reassessment. |
The most dangerous error is false precision. A design parameter with three decimal places is not automatically reliable if the site model, groundwater assumption, or sample quality is weak.
Relevant Manuals, Data Sources, and Design References
Geotechnical data analysis should be grounded in recognized investigation practice, testing standards, and project-specific design requirements. Public technical manuals are especially useful for understanding how exploration data, laboratory data, field testing, and engineering interpretation fit together.
- Federal Highway Administration: FHWA geotechnical site characterization guidance covers subsurface investigation planning, field and laboratory data, interpretation of soil and rock parameters, and the connection between site characterization and design.
- Project-specific criteria: Owner requirements, local agency manuals, bridge or building criteria, and project risk classification can change how much exploration is needed and how conservative parameter selection should be.
- Engineering use: References help define good practice, but the final model still depends on site-specific evidence, testing quality, groundwater interpretation, and engineering judgment.
Frequently Asked Questions
Geotechnical data analysis is the process of checking, organizing, interpreting, and applying soil, rock, groundwater, field, laboratory, and monitoring data so engineers can build defensible subsurface models and select design parameters for foundations, slopes, retaining systems, excavations, and earthworks.
Common data includes boring logs, test pit observations, SPT and CPT results, groundwater readings, soil and rock samples, lab classification tests, shear strength tests, consolidation tests, permeability tests, geophysical data, construction observations, and monitoring records such as settlement points, piezometers, and inclinometers.
Engineers compare boring logs, sample descriptions, field test values, groundwater observations, laboratory results, site geology, and project loading to infer soil and rock layers between exploration points. The result is an interpreted subsurface model that approximates likely ground conditions for design rather than a perfect picture of the ground.
Factual geotechnical data is measured or observed information such as boring depths, sample descriptions, groundwater readings, and test results. Interpretive data is the engineering judgment built from that evidence, including layer boundaries, design groundwater levels, strength parameters, compressibility values, and recommendations.
The most common mistake is treating limited subsurface data as more certain than it is. Engineers should avoid blindly averaging values, ignoring groundwater variability, discarding outliers without investigation, or assuming layer boundaries are exact between borings.
Summary and Next Steps
Geotechnical data analysis is the bridge between investigation and design. It converts boring logs, field tests, lab results, groundwater observations, and monitoring data into a defensible subsurface model and practical design parameters.
The strongest analysis checks data quality before selecting values, separates factual observations from interpretation, documents uncertainty, and tests whether the model actually supports the design decision being made. In practice, the best geotechnical data analysis is not the most complicated; it is the most traceable, consistent, and relevant to the project risk.
Where to go next
Continue your learning path with related Turn2Engineering resources.
-
Soil Mechanics
Build the foundation for interpreting strength, compressibility, permeability, effective stress, and groundwater-sensitive behavior.
-
Soil Testing
Learn how laboratory and field tests generate the data that feeds geotechnical interpretation.
-
Foundation Design
See how interpreted subsurface data becomes footing, mat, pile, settlement, and bearing decisions.