Key Takeaways
- Definition: Intelligent transportation systems (ITS) combine sensors, communications, computing, and control strategies to monitor and manage transportation networks in real time, improving safety, efficiency, reliability, and traveler information.
- Application: ITS shows up in adaptive signal control, ramp metering, transit priority, variable speed limits, incident management, work-zone monitoring, and corridor management across freeways and arterial networks.
- Outcome: After reading, you will understand the core building blocks of ITS, typical architectures, key performance metrics, and how to walk through a simple benefit assessment for an ITS project.
- Context: ITS is a core part of modern transportation engineering, sitting alongside geometric design, traffic flow theory, and public transportation planning as a way to get more performance out of existing infrastructure.
Table of Contents
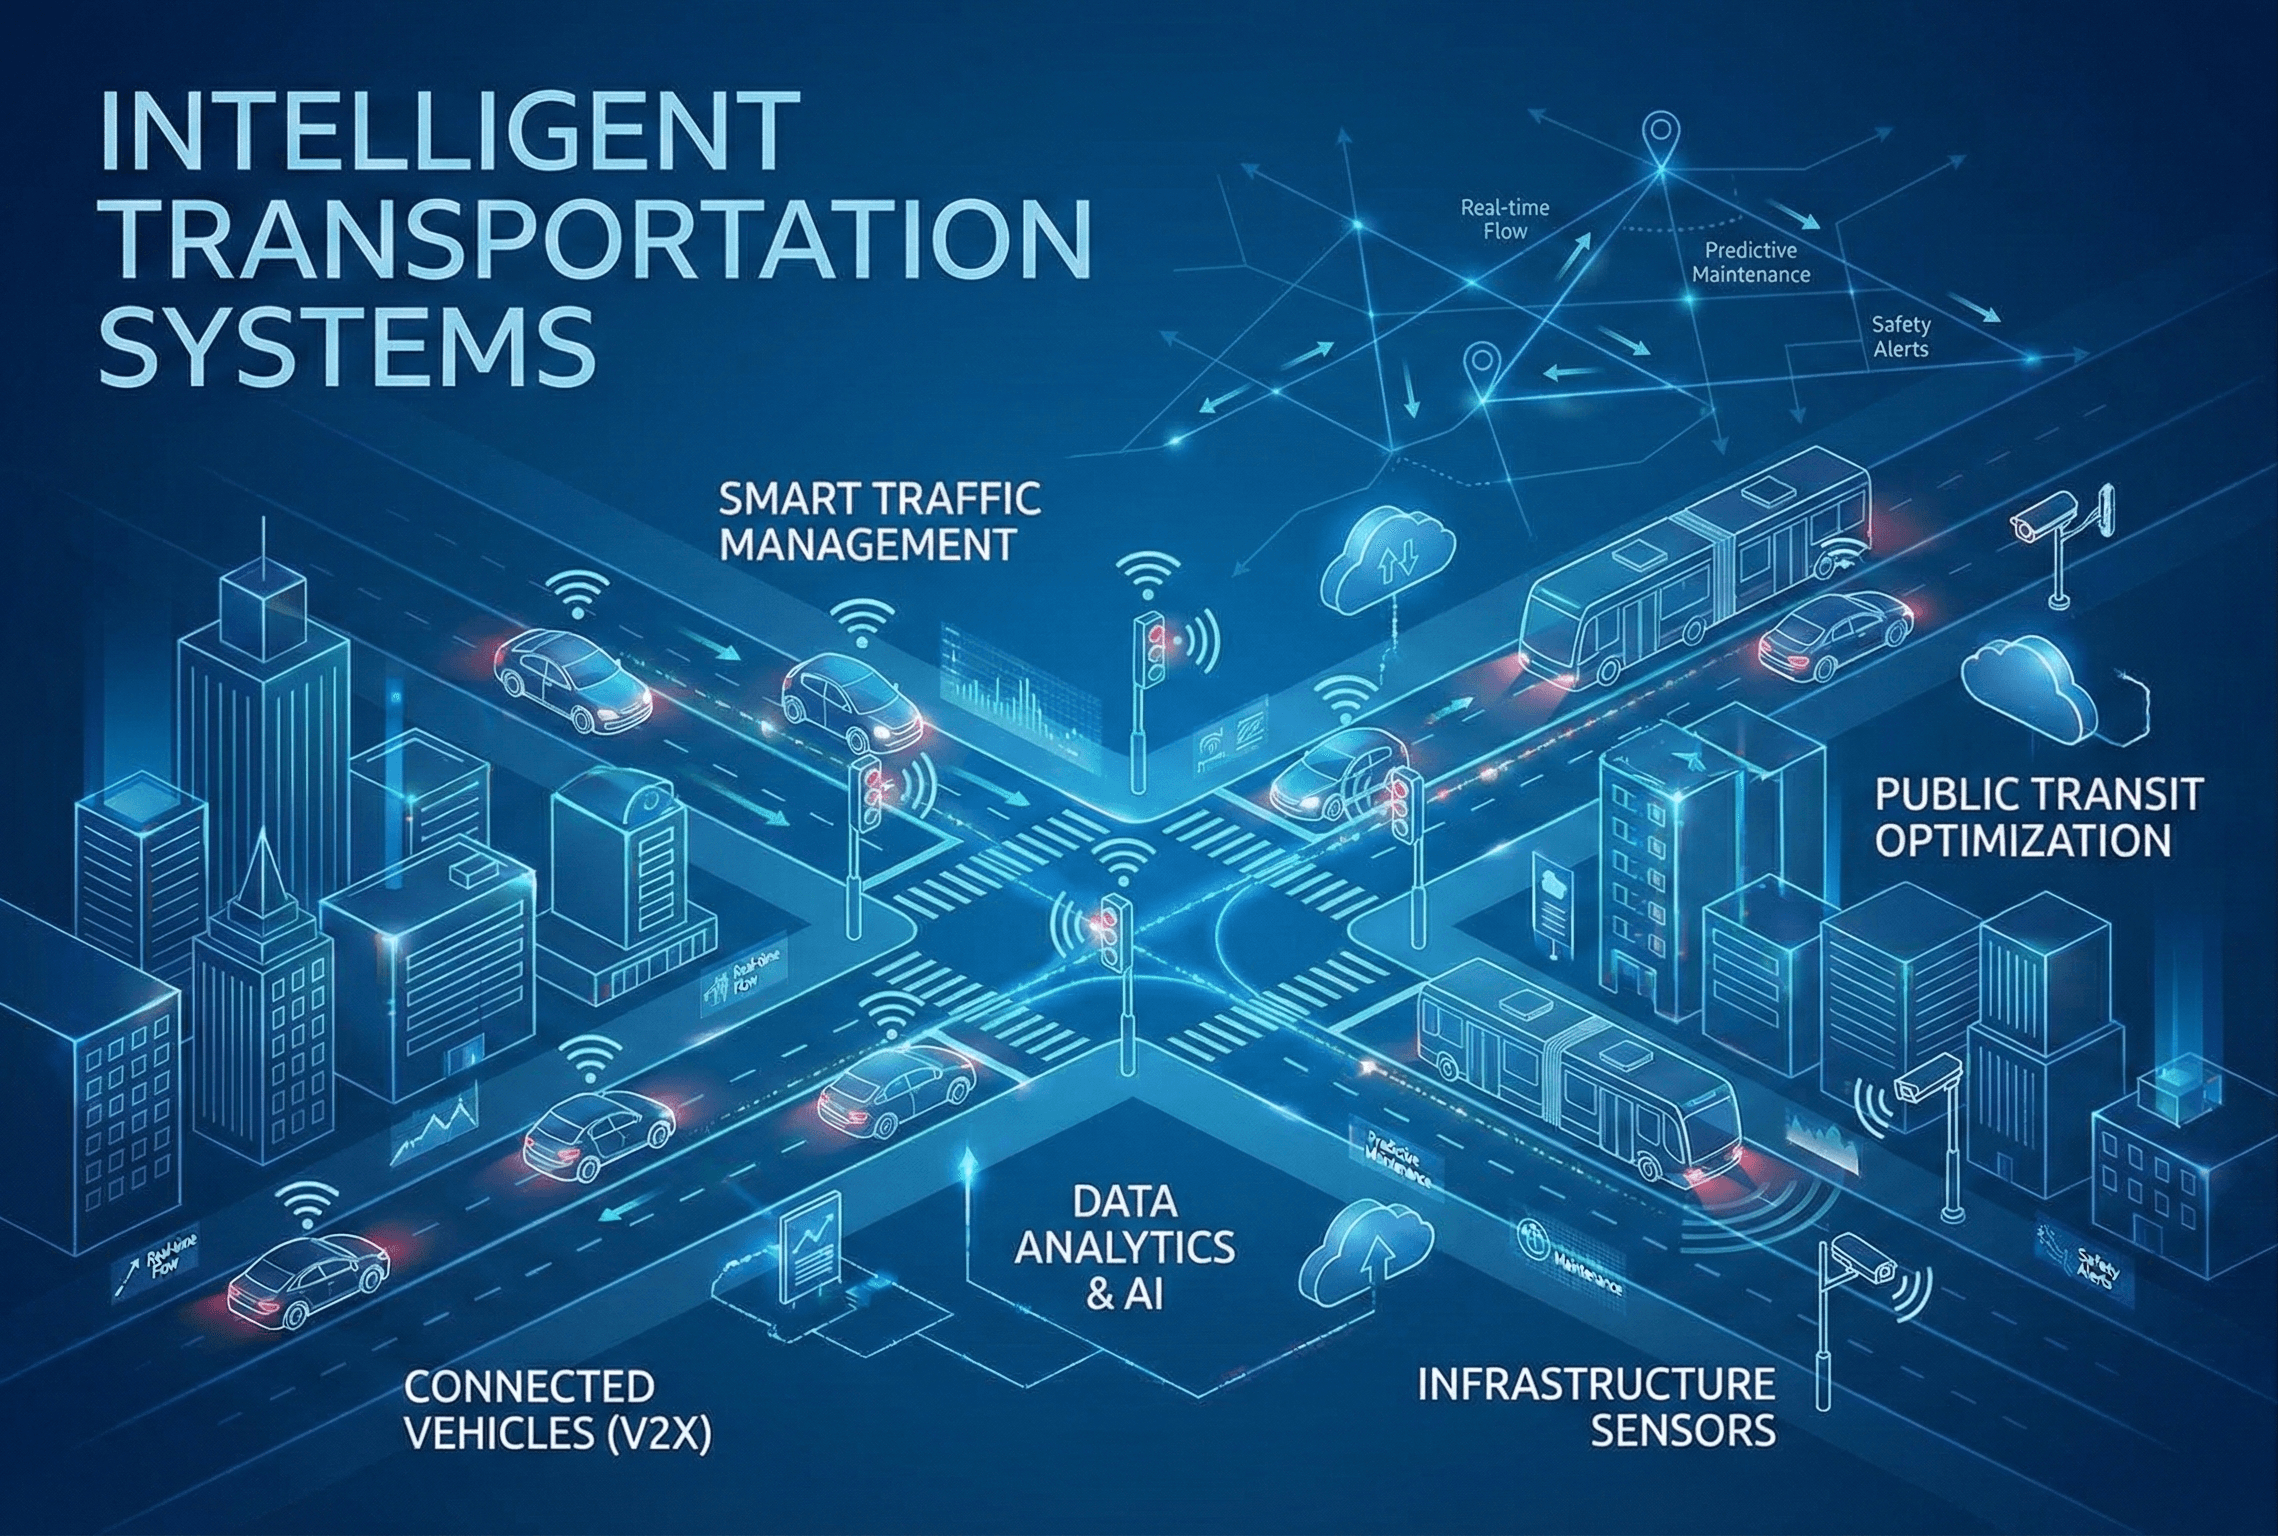
Intelligent transportation systems overview diagram
Introduction
Transportation agencies are under constant pressure to move more people and freight, improve safety, and reduce delay without endlessly widening roads. Intelligent transportation systems (ITS) are one of the main ways engineers squeeze more performance out of the network that already exists.
Rather than relying only on fixed-time signals and static signs, ITS adds sensing, communication, computing, and control. Field devices measure what is happening on the road, send data to a traffic management center or cloud platform, and control strategies respond in real time with updated signal timings, speed limits, messages, and priority calls.
This page walks through what ITS actually is in transportation engineering practice, the core components of a typical system, common applications, key performance metrics and equations, a simple benefit example, and how standards and architectures keep projects interoperable and maintainable.
What are intelligent transportation systems (ITS)?
Intelligent transportation systems (ITS) are integrated combinations of sensors, communications, computing, and control strategies that monitor and manage transportation networks in real time to improve safety, efficiency, reliability, and user information without necessarily building new physical capacity.
In practice, ITS is not a single “thing” but a toolbox of technologies and strategies. Examples include adaptive traffic signal control, freeway ramp metering, variable speed limits, dynamic message signs, automated incident detection, and transit signal priority. Each element relies on real-time data and algorithms to adjust how the system operates.
For a transportation engineer, ITS is a way to align operations with design. Geometric design sets the physical limits of a facility; ITS helps you operate that facility closer to its safe, reliable potential by responding to congestion, incidents, weather, and special events as they happen.
Core components of an intelligent transportation system
Most ITS deployments can be understood as four interacting layers: field sensing and detection, communications and data backhaul, processing and decision logic, and interfaces that deliver control actions or information back to road users and operators.
Field sensing and detection
Field devices measure what is happening on the network. Common examples are inductive loops, radar and video detectors, Bluetooth or Wi-Fi travel time sensors, automatic incident detection cameras, weather stations, and GPS feeds from connected vehicles and transit fleets.
Communications and data backhaul
Raw or aggregated data must reach a traffic management center or cloud platform. Agencies use a mix of fiber, leased lines, microwave links, cellular networks, and, increasingly, dedicated short-range communications (DSRC) or C-V2X for vehicle-to-everything (V2X) applications.
Processing, decision logic, and control
Servers and software transform data into decisions. This includes signal timing algorithms, ramp metering logic, incident detection models, travel time estimation, and decision support tools that propose or automatically implement response plans when certain thresholds are crossed.
User interfaces and information channels
Finally, ITS must act on the system. Control is applied via signal controllers, ramp meters, lane control signs, dynamic message signs, and variable speed limits. Information is delivered through roadside signs, traveler information websites and apps, 511 systems, in-vehicle displays, and transit passenger information systems.
- q Traffic flow (vehicles/hour), measured by detectors and used to estimate volume–capacity ratios.
- TT Average travel time along a corridor (minutes), often estimated from probe vehicles or Bluetooth/Wi-Fi sensors.
- RT Incident response time (minutes) from detection to clearance, a critical safety and reliability metric.
- U System uptime (%), describing how often critical ITS devices and communications are functioning as intended.
When defining an ITS concept, describe what you want to measure and control in terms of these performance metrics before choosing devices or vendors. Starting from outcomes keeps the architecture simpler and easier to justify to stakeholders.
Performance metrics and simple ITS equations
ITS performance is usually evaluated using traffic flow theory metrics and reliability statistics rather than exotic new formulas. The same basic relationships for flow, speed, and capacity still apply; ITS helps you move the operation closer to desired targets.
Here \(TT\) is average travel time along a segment of length \(L\) (km or mi) with average speed \(v\). The volume-to-capacity ratio \(v/c\) compares observed flow \(q\) to practical capacity \(c\). The reliability index \(R_{95}\) compares the 95th percentile travel time \(T_{95}\) to the median \(T_{\text{median}}\).
A successful ITS deployment generally aims to reduce \(TT\), keep \(v/c\) in acceptable ranges for the facility type, and drive \(R_{95}\) closer to 1 (less variability). For more detailed flow relationships, you can revisit Traffic Flow Theory and apply those concepts to before-and-after ITS conditions.
When you are ready to move from hand calculations into quick experiments with volumes, capacities, and travel times, it is often convenient to prototype scenarios using spreadsheet models or by pairing this article with Turn2Engineering’s transportation and traffic calculators.
Design workflow for an ITS deployment
Designing ITS is as much about process and stakeholders as it is about devices. A good workflow keeps the project aligned with needs, standards, and long-term maintainability.
- Define goals and constraints. Identify corridor problems (e.g., recurring congestion, high crash rates, unreliable transit headways) and set measurable objectives such as “reduce corridor peak travel time by 10%” or “cut secondary crashes by 20%.”
- Map existing infrastructure. Inventory signals, cabinets, controllers, communication assets, and power. Understand what can be reused and where bottlenecks or single points of failure exist.
- Select strategies and use cases. Choose ITS strategies that align with goals: adaptive signal control, ramp metering, queue warning, dynamic message signs, transit priority, or integrated corridor management, for example.
- Develop the ITS architecture. Prepare a high-level and detailed architecture showing field devices, communications, servers, operator interfaces, and data exchanges. Align it with regional or national ITS architectures where required.
- Design field layouts and communications. Locate detectors, cameras, and signs; size conduits and cabinets; design communication links; and ensure power and maintenance access are feasible for each device.
- Specify software, logic, and integrations. Define algorithm requirements (e.g., minimum and maximum green times, metering rates, priority thresholds), database structures, interface protocols, and cybersecurity expectations.
- Plan testing, operations, and maintenance. Establish acceptance testing plans, standard operating procedures, training, and routine maintenance strategies before issuing construction documents.
Before final design, a senior engineer should verify that every ITS element appears in the needs statement, architecture, plans, and operations plan. If a device or software feature does not clearly support a stated objective, it often becomes an expensive future maintenance burden.
Worked example: estimating travel-time benefits
Example
Suppose an agency is considering adaptive signal control on a 5 km urban arterial corridor with 8 signalized intersections. Today, probe data show an average peak-hour travel time of 18 minutes in the peak direction and a 95th percentile travel time of 26 minutes.
Based on pilot studies and vendor data, the team estimates adaptive control can reduce average control delay by about 15%. Assuming the corridor speed is mostly influenced by signal delay, you can approximate the new mean travel time as \(TT_{\text{new}} = 0.85 \times TT_{\text{base}}\).
With \(TT_{\text{base}} = 18\) minutes, the new average travel time is \(TT_{\text{new}} = 0.85 \times 18 \approx 15.3\) minutes, a savings of 2.7 minutes per vehicle. If 1,200 vehicles traverse the corridor in the peak hour, the system saves roughly 54 vehicle-hours of delay in that hour alone.
Repeating a similar calculation for reliability, assume the 95th percentile travel time drops proportionally from 26 to \(0.85 \times 26 \approx 22.1\) minutes. The reliability index shifts from \(R_{95} = 26 / 18 \approx 1.44\) to \(R_{95} \approx 22.1 / 15.3 \approx 1.44\) if variability scales similarly, or better if the adaptive system smooths out extreme congestion.
While simplistic, this style of calculation is often sufficient for early screening and benefit-cost scoping, before you invest in detailed microsimulation or field trials. Later design phases can refine these estimates with more realistic operational models.
Common pitfalls and engineering checks in ITS projects
ITS projects fail more often because of integration, maintenance, and institutional issues than because of pure hardware problems. A few recurring pitfalls show up across many agencies.
- Deploying devices without a clear operations plan or staff to monitor and respond to the data.
- Underestimating communications bandwidth or redundancy needs, leading to unreliable device connections.
- Ignoring data quality, leading to algorithms and dashboards built on noisy or biased measurements.
- Over-customizing software, making future upgrades and vendor changes difficult or expensive.
- Failing to budget for lifecycle maintenance, resulting in dark signs and failed detectors within a few years.
A frequent mistake is designing complex adaptive systems on corridors where detection coverage is sparse or unreliable. Without robust, well-maintained detection, even the best control algorithms will behave unpredictably and can worsen congestion or safety.
| Parameter | Symbol | Typical units | Notes |
|---|---|---|---|
| Detection coverage | DC | % of lanes/approaches | Aim for high coverage on critical movements; gaps reduce the value of adaptive strategies. |
| Communications latency | τ | seconds | High latency can make real-time control unstable or ineffective, especially for rapid incident response. |
| System availability | U | % uptime | Many agencies target > 99% uptime for core devices that support safety-critical operations. |
| Operator coverage | OC | hours/day | A 24/7 system with no overnight operators may require automated response plans and escalation rules. |
Work with real numbers
Engineering calculators & equation hub
Jump from theory to practice with interactive calculators and equation summaries covering civil, mechanical, electrical, and transportation topics.
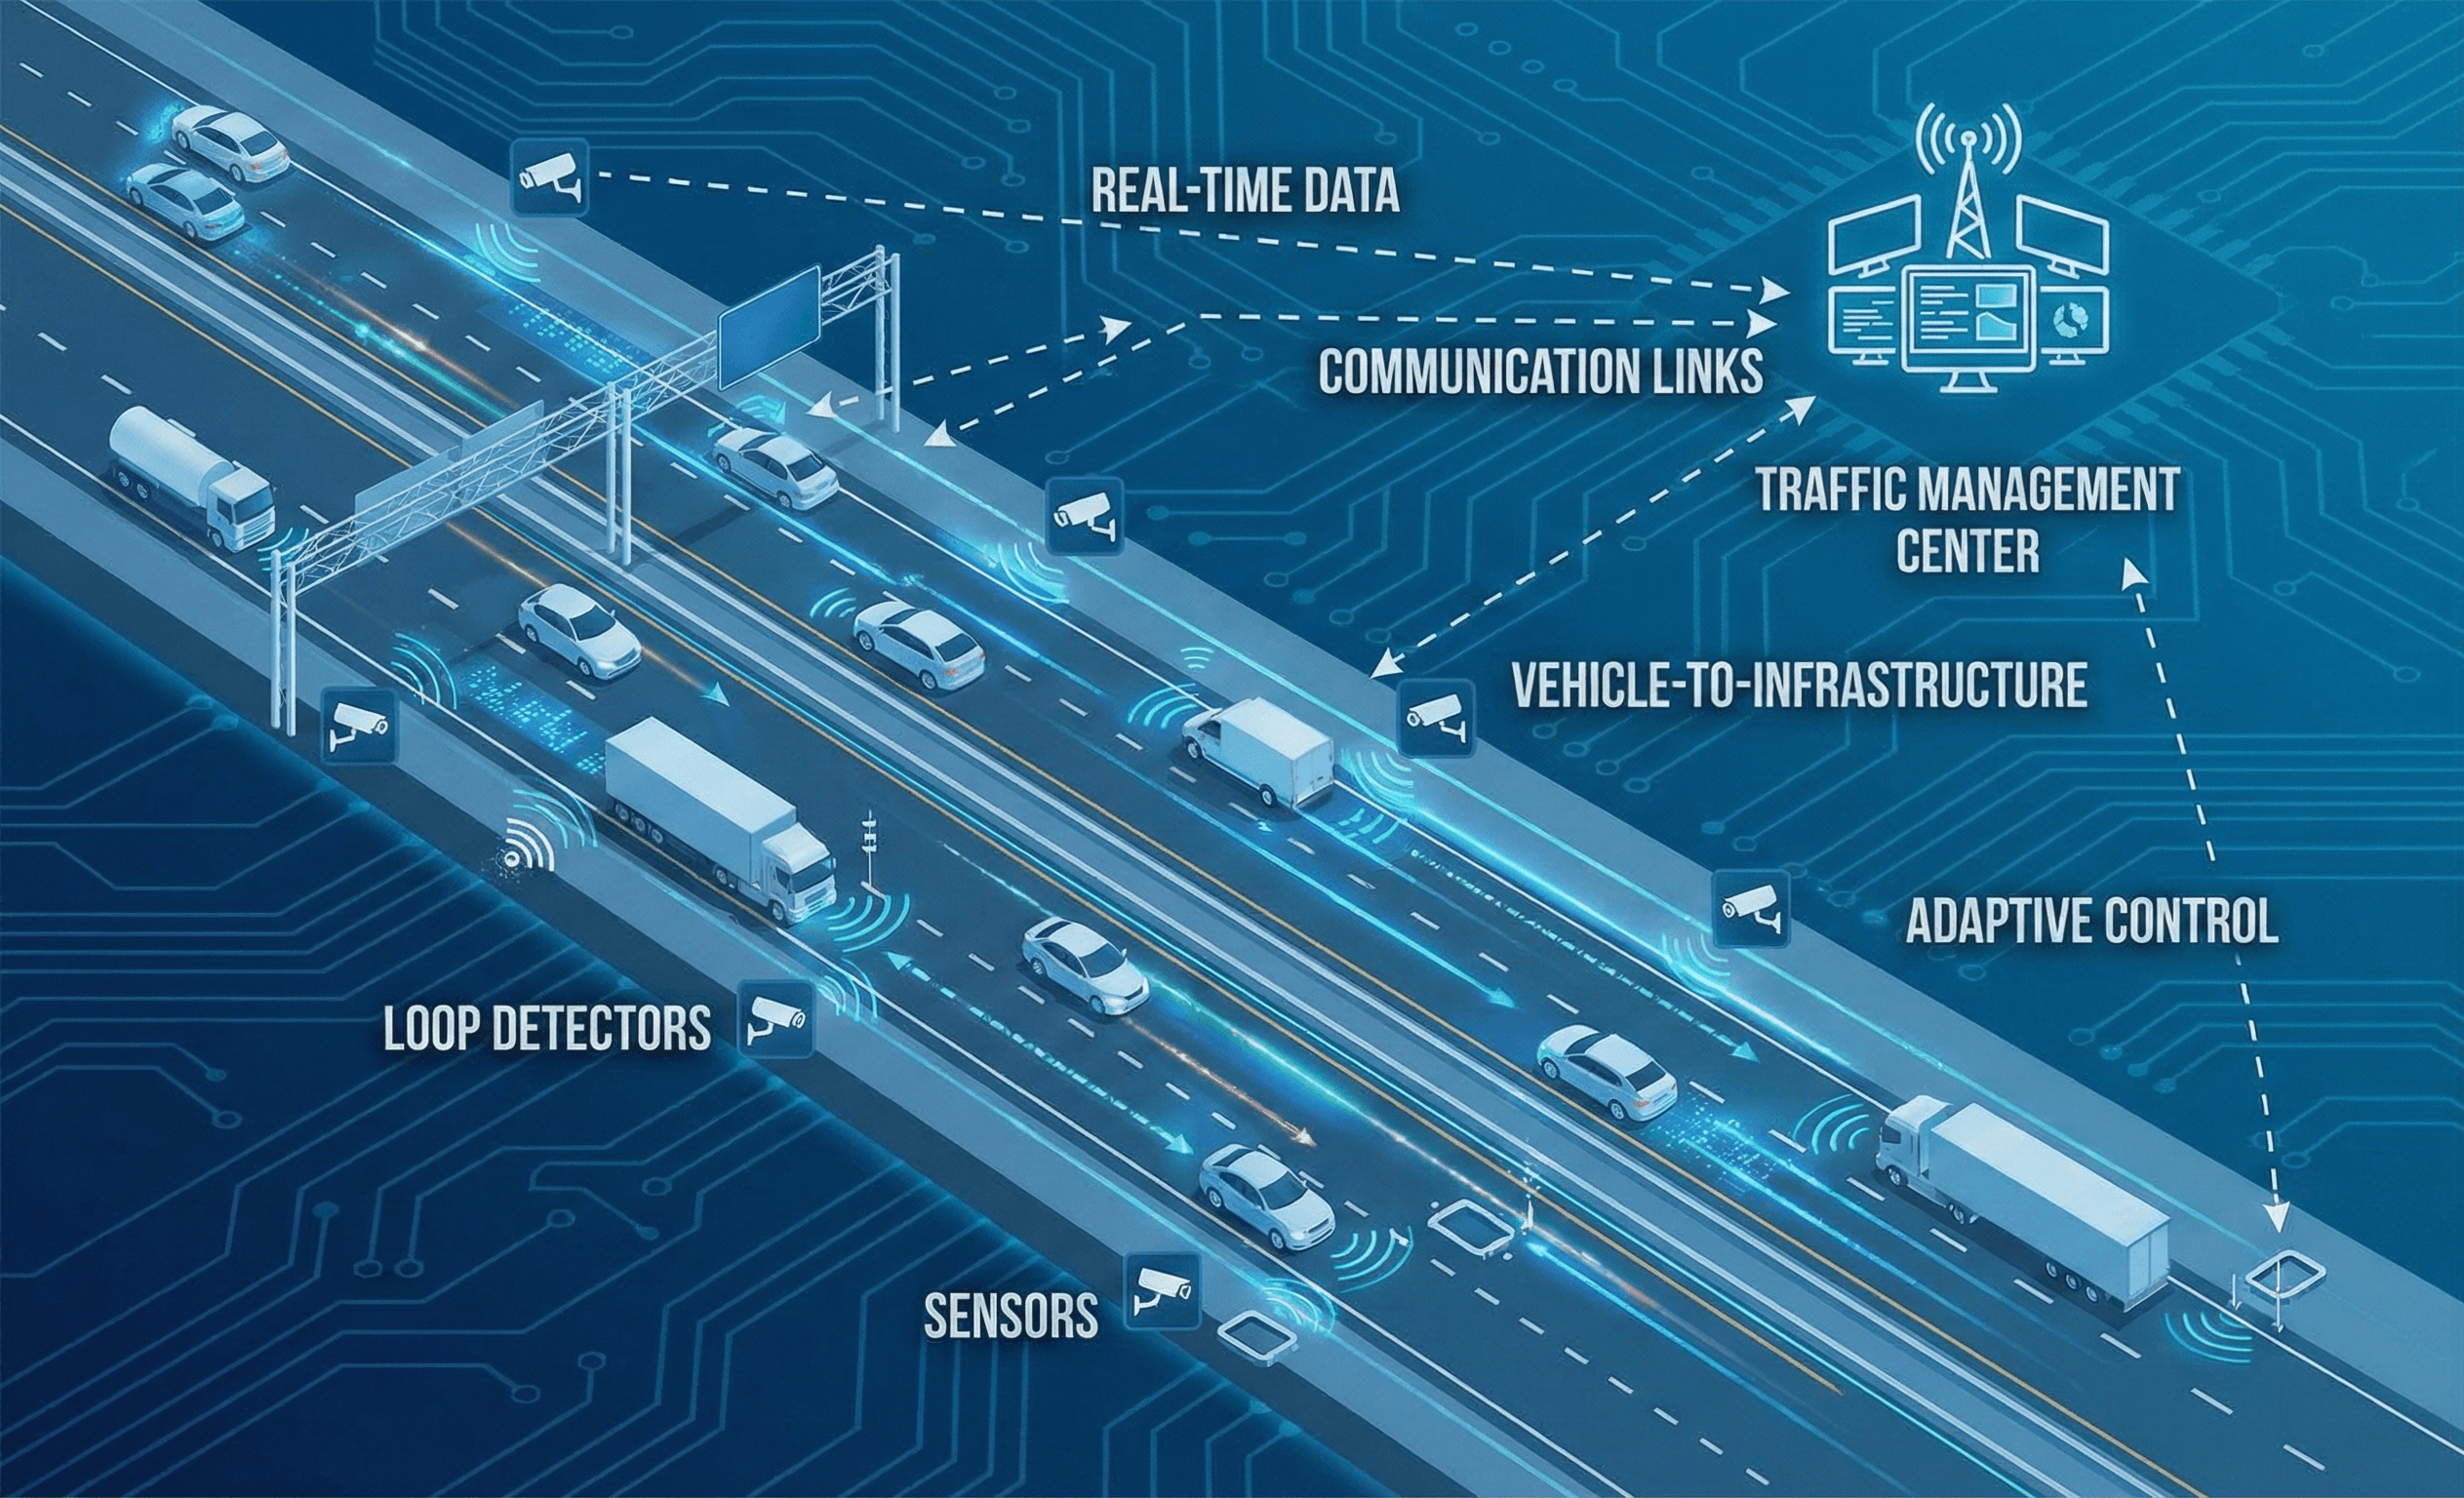
Visualizing an ITS-enabled corridor
It often helps to see how ITS components line up along a real corridor. The conceptual diagram below shows detectors, cameras, message signs, and signals feeding a central system and responding with coordinated control actions.
ITS standards, architectures, and design references
Because ITS projects involve many devices, vendors, and agencies, standards and architectures are essential to keep systems interoperable and maintainable over decades. Most transportation agencies align new deployments with regional or national ITS frameworks.
- ITS architectures (e.g., ARC-IT): Provide a structured way to describe user services, subsystems, and information flows. Many regions require consistency with a regional architecture before funding ITS deployments.
- NTCIP and communications standards: Define how field devices (signals, dynamic message signs, detectors) communicate with central systems. Using open protocols reduces vendor lock-in and simplifies future upgrades.
- MUTCD and traffic control standards: Govern how messages, symbols, and signals are displayed to road users. Even with advanced ITS, devices must still comply with these safety-critical requirements.
- Highway Capacity Manual (HCM) and related manuals: Provide methods to estimate capacity, level of service, and reliability. These are often used to quantify the operational benefits of ITS strategies for planning and design reports.
- Agency design and operations manuals: State DOTs and cities frequently publish ITS design guides, detailing preferred devices, cabinet layouts, naming conventions, and cybersecurity practices tailored to their networks.
Frequently asked questions
An intelligent transportation system (ITS) uses sensors, communications, computing, and control strategies to monitor and manage transport networks in real time, improving safety, efficiency, reliability, and traveler information compared with purely static systems.
Typical ITS examples include adaptive traffic signal control, ramp metering, variable speed limits, dynamic message signs, transit signal priority, queue warning systems, automated incident detection, and integrated corridor management platforms spanning multiple facilities.
Field devices send real-time data to a traffic management center, where operators and decision-support software monitor conditions, adjust control strategies, coordinate incident response, and push information back to signs, media channels, and partner agencies.
No. ITS can scale from low-cost flashing beacons, school-zone warning systems, and small rural dynamic signs to complex freeway management systems in large metro areas; the key is matching the solution to local needs and resources.
Summary and next steps
Intelligent transportation systems are how modern agencies operate networks that were largely designed decades ago. By combining sensors, communications, computing, and control, ITS lets engineers monitor real-time conditions and adjust how a corridor runs rather than accepting fixed-time plans and blind spots.
For transportation engineers, that means thinking beyond geometry and capacity to include data quality, algorithms, device reliability, and human operators. The most successful ITS projects start with clear performance goals, use architectures and standards to keep systems interoperable, and budget for long-term maintenance and staffing.
As you continue studying transportation engineering, keep ITS in mind as a bridge between theory and field operations. Flow relationships, reliability metrics, and safety analyses all become more powerful when they are tied to real-time sensing and responsive control.
Where to go next
Continue your learning path with these curated next steps in transportation engineering.
-
Study Traffic Flow Theory
See how fundamental relationships between flow, speed, and density underpin many ITS performance measures and control strategies.
-
Explore Transportation Modeling
Learn how macroscopic and microscopic models are used to test ITS strategies before they are deployed in the field.
-
Practice with transportation engineering calculators
Apply equations from this page with interactive tools that help you test scenarios and build intuition around traffic performance metrics.
Work with real numbers
Engineering calculators & equation hub
Jump from theory to practice with interactive calculators and equation summaries covering civil, mechanical, electrical, and transportation topics.