Key Takeaways
- Core idea: Flood predictive modeling estimates when flooding may occur, where floodwater may spread, and how severe the resulting stage, depth, velocity, duration, and inundation could become.
- Engineering use: Water resources engineers use flood prediction models for warning systems, floodplain analysis, emergency planning, stormwater planning, transportation closures, and infrastructure resilience.
- What controls it: Rainfall forecast quality, streamgage coverage, soil moisture, terrain accuracy, channel geometry, bridges, culverts, roughness, boundary conditions, and forecast lead time strongly control the result.
- Practical check: A flood model should not be trusted only because it looks detailed; it must be checked against observed data, field conditions, hydraulic controls, action thresholds, and uncertainty.
Table of Contents
Introduction
Flood predictive modeling estimates future flood conditions by combining rainfall forecasts, streamgage data, watershed response, terrain, hydraulic controls, and sometimes machine learning. In water resources engineering, the goal is to predict not only whether flooding may occur, but when it may peak, where water may spread, how deep it may get, and what warning or response action it should trigger.
Flood Predictive Modeling Workflow
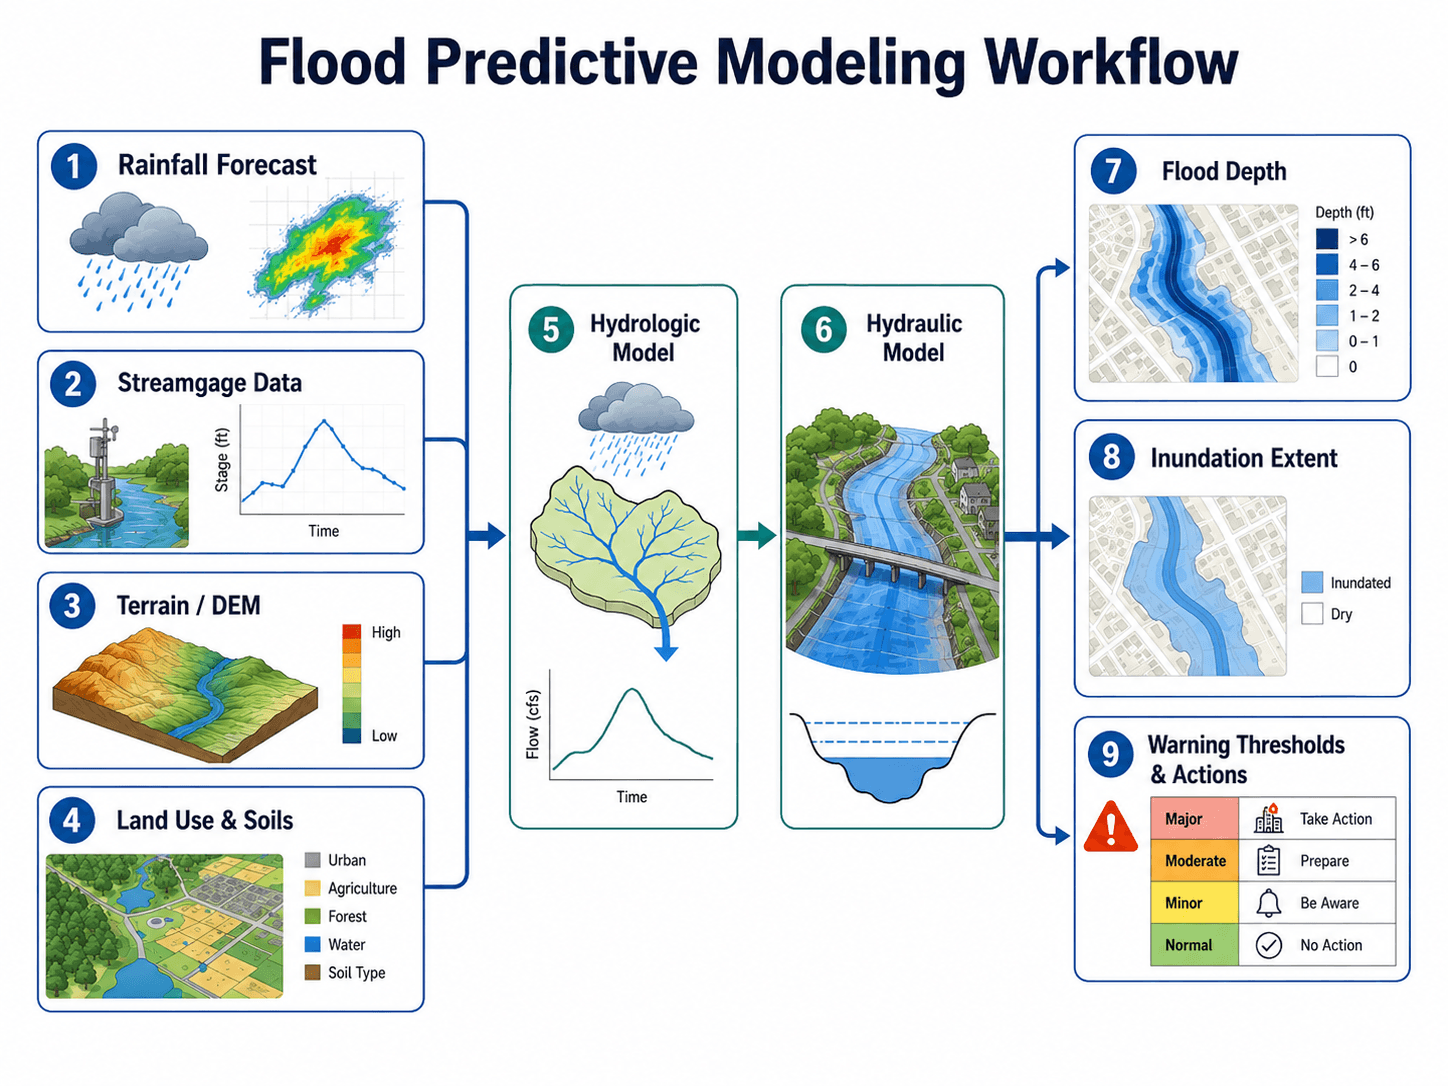
Read the workflow from left to right. The most important idea is that the prediction is only as reliable as the rainfall forecast, streamgage data, terrain, model assumptions, calibration history, and decision thresholds behind it.
What Is Flood Predictive Modeling?
Flood predictive modeling is the process of estimating future flood behavior before or during a storm event. A model may predict peak discharge, time to peak, arrival time, river stage, flood depth, flood velocity, inundation extent, probability of threshold exceedance, or the likely duration of flooding.
The phrase covers more than one method. A rainfall-runoff model may estimate how much water reaches a stream. A hydraulic model may estimate where that water spreads across a floodplain. A data-driven or machine learning model may estimate stage, discharge, or flood likelihood from historical and real-time patterns. A strong flood prediction workflow often combines several of these approaches instead of relying on one model type.
A useful flood prediction model should answer five practical questions: when will the flood arrive, when will it peak, how high will water get, where will it spread, and what action threshold does that trigger?
Flood Predictive Modeling vs Flood Forecasting vs Flood Mapping
Flood predictive modeling is often confused with flood forecasting, flood inundation mapping, flood risk assessment, and regulatory floodplain mapping. They overlap, but they answer different engineering and planning questions.
| Term | Main question it answers | Typical output | How it connects to flood predictive modeling |
|---|---|---|---|
| Flood predictive modeling | What flood conditions are likely to happen? | Predicted stage, discharge, depth, velocity, extent, duration, or probability. | It is the broad technical process used to estimate future flood behavior. |
| Flood forecasting | When will flooding occur and how high will the river get? | Forecast hydrograph, river stage forecast, lead time, and warning thresholds. | It is the operational use of predictive models, real-time data, and forecast updates. |
| Flood inundation mapping | Where will floodwater go at a given stage or flow? | Flood depth grids, inundation polygons, and mapped flood extents. | It translates predicted stage or discharge into a spatial floodplain impact. |
| Flood risk assessment | What could be damaged and how severe could the consequence be? | Exposure, vulnerability, consequence, likelihood, and risk level. | It uses predicted or mapped flood hazards to evaluate people, assets, infrastructure, and economic impacts. |
| Regulatory floodplain mapping | What area is regulated for floodplain management? | Flood insurance rate maps, base flood elevations, and mapped hazard zones. | It may use hydraulic modeling, but it is usually not a real-time forecast of a specific storm. |
In the United States, operational flood prediction often involves National Weather Service river forecasts, NOAA water prediction products, USGS streamgage data, local emergency management thresholds, and community-specific flood response plans.
How Flood Predictive Modeling Works
Most flood predictive modeling workflows begin with rainfall, streamflow, and watershed data. The model first estimates how precipitation becomes runoff, then routes that runoff through channels, floodplains, reservoirs, culverts, bridges, storm drains, or other hydraulic controls. The final output is usually translated into stage forecasts, inundation maps, flood depth grids, warning thresholds, or emergency response triggers.
Rainfall and watershed response
Rainfall does not immediately become river flow. Some water infiltrates, some is stored in depressions, some is intercepted by vegetation, and some becomes direct runoff. Antecedent soil moisture, impervious cover, drainage density, slope, storm duration, and rainfall intensity can change the timing and magnitude of the flood hydrograph.
Streamgage data and forecast updating
Streamgages provide observed stage and discharge that can be compared with the model forecast. In real-time systems, streamgage readings help engineers and forecasters update predictions, detect whether a river is rising faster than expected, and compare modeled conditions against measured behavior.
Terrain, hydraulics, and inundation
Terrain data controls where floodwater can spread. Hydraulic models use channel geometry, floodplain shape, roughness, bridges, culverts, levees, and downstream controls to estimate water surface elevations, flood depths, velocities, and inundation extents. Small terrain or structure errors can create large local differences in the mapped flood boundary.
What a Real-Time Flood Prediction System Includes
A real-time flood prediction system is more than a model file. It is a chain of data collection, quality control, forecasting, simulation, interpretation, and communication. If one part of that chain fails, the final warning may be late, overconfident, or misleading.
| System component | What it does | Why it matters for flood prediction |
|---|---|---|
| Data ingestion | Collects rainfall forecasts, radar rainfall, observed precipitation, streamgage readings, reservoir levels, and field reports. | The model cannot predict current conditions well if it starts from stale or incomplete data. |
| Data validation | Checks for sensor errors, missing values, unrealistic jumps, datum issues, and communication failures. | Bad stage or rainfall data can create a false warning or hide a real flood threat. |
| Hydrologic forecast | Converts forecast rainfall and watershed conditions into runoff and streamflow hydrographs. | This step controls peak discharge, arrival time, and time to peak. |
| Hydraulic or inundation model | Routes predicted flow through channels and floodplains to estimate stage, depth, velocity, and extent. | This step translates flow into actual floodplain impact. |
| Uncertainty handling | Shows a range of possible outcomes rather than one exact boundary or stage. | Flood decisions should account for forecast spread, especially when consequences are high. |
| Threshold logic | Compares predicted stage, depth, or extent against action levels. | This converts model output into a clear operational decision. |
| Alert distribution | Communicates warning levels, maps, timing, and recommended actions to the right users. | A technically accurate forecast has limited value if it does not reach decision-makers in time. |
Hydrologic, Hydraulic, and Machine Learning Flood Models
Flood predictive modeling is not one single model. The best approach depends on the question being answered. A watershed-scale runoff forecast, a floodplain inundation map, and a real-time probability alert may all require different model logic.
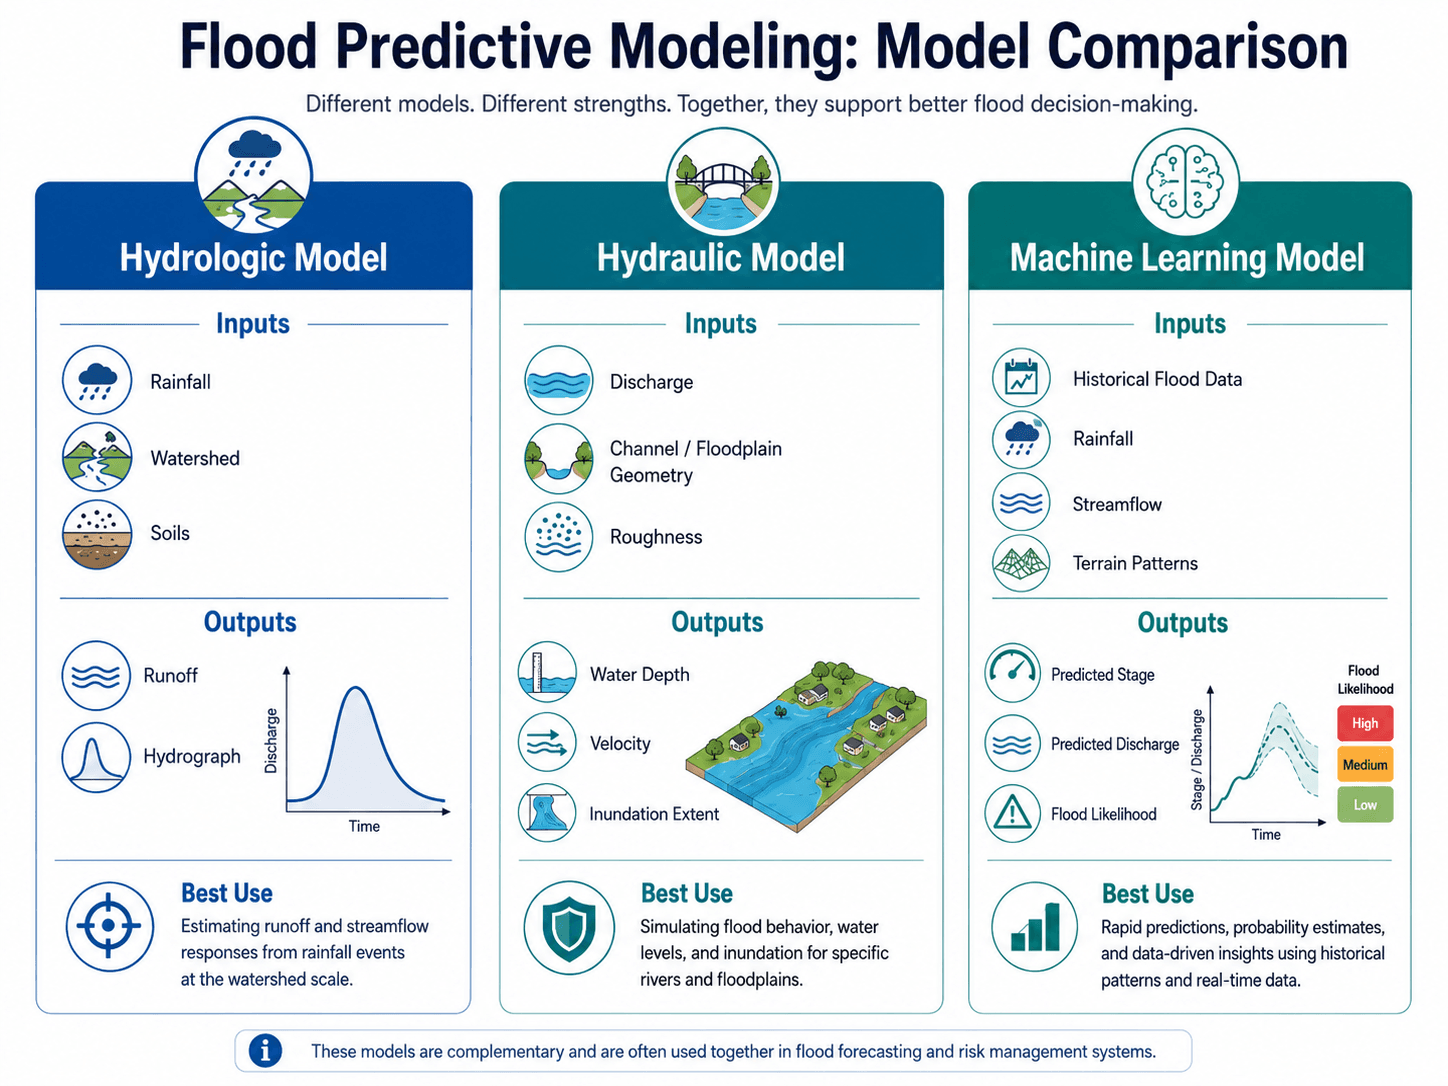
| Model type | Primary purpose | Typical inputs | Typical outputs |
|---|---|---|---|
| Hydrologic model | Estimate how rainfall becomes runoff and streamflow over time. | Rainfall, watershed area, land use, soils, losses, storage, and routing assumptions. | Runoff volume, peak discharge, time to peak, and hydrograph shape. |
| Hydraulic model | Estimate how flow moves through channels, bridges, culverts, and floodplains. | Discharge, channel geometry, terrain, roughness, structures, and boundary conditions. | Water surface elevation, flood depth, velocity, shear, and inundation extent. |
| Machine learning model | Estimate flood likelihood, stage, discharge, or warning thresholds from patterns in data. | Historical floods, rainfall, streamflow, radar data, terrain attributes, and real-time sensor feeds. | Predicted stage, predicted discharge, probability bands, or threshold exceedance alerts. |
| Hybrid forecasting system | Combine physics-based modeling, observations, forecast rainfall, and data-driven updates. | Weather forecasts, streamgages, terrain, watershed models, hydraulic models, and calibration history. | Forecast hydrographs, inundation maps, uncertainty bands, and warning actions. |
Where machine learning helps—and where it does not
Machine learning can be useful for rapid stage prediction, threshold exceedance probability, broad screening, pattern recognition, and forecast updating where reliable historical and real-time data are available. It is less reliable when training data is sparse, watershed behavior changes, extreme events fall outside the training record, or the model cannot be interpreted well enough for engineering review.
Choosing the Right Flood Prediction Approach
The right modeling approach depends on the decision. A community warning system, bridge overtopping review, regional screening study, and detailed floodplain analysis do not need the same model resolution or data requirements.
| If the goal is… | Best modeling approach | Why it fits |
|---|---|---|
| Estimate runoff from forecast rainfall | Hydrologic model | Converts storm rainfall, watershed losses, and storage into a predicted hydrograph. |
| Predict flood depth along a river corridor | Hydraulic model | Simulates water surface elevation, overbank flow, depth, and velocity through channels and floodplains. |
| Issue rapid warnings at streamgages | Forecasting, machine learning, or hybrid system | Uses observed data and updated forecasts to predict threshold exceedance and lead time. |
| Evaluate bridge, culvert, or roadway impacts | Hydraulic model with structure representation | Captures backwater, overtopping, inlet control, outlet control, and local restrictions. |
| Compare community flood exposure | Inundation model plus GIS overlay | Connects flood depth and extent to buildings, roads, utilities, and critical facilities. |
| Screen many basins quickly | Regional model or machine learning model | Supports broad prioritization when detailed hydraulic modeling is not practical for every location. |
| Support emergency action thresholds | Hybrid forecast with defined action levels | Connects predicted stage, depth, or extent to operational actions such as alerts, closures, or evacuations. |
Flood Prediction Inputs That Control Model Quality
Flood prediction is highly sensitive to input quality. A model with polished maps and detailed charts can still be misleading if the rainfall forecast is wrong, the terrain is outdated, the channel geometry is simplified, or an important bridge, culvert, levee, or storm drain restriction is missing.
| Input or assumption | Why it matters | Engineering implication |
|---|---|---|
| Rainfall forecast | Controls the timing, volume, intensity, and spatial distribution of runoff. | A shifted storm cell can move the flood peak to a different tributary or change the forecast stage. |
| Radar rainfall and nowcasting | Shows short-term storm intensity and spatial movement during an active event. | Useful for flash flood prediction where conditions change faster than traditional forecasts update. |
| Streamgage stage and discharge | Provides observed river response for calibration and forecast updating. | Without reliable gauges, the model may be difficult to verify during a real event. |
| Forecast lead time | Determines how much time remains before the predicted flood impact. | A highly accurate forecast may still be operationally weak if it arrives too late for action. |
| Terrain / DEM | Controls flow paths, floodplain storage, overbank spread, and local low points. | Outdated terrain can miss new development, embankments, grading, and drainage changes. |
| Land use and impervious cover | Controls infiltration, runoff volume, and how fast water reaches channels. | Urbanization can increase peak flow and shorten warning lead time. |
| Soil moisture and previous rainfall | Controls how much rainfall is stored versus converted to runoff. | A saturated watershed can flood from rainfall that would not cause flooding under dry conditions. |
| Reservoir or detention storage | Controls how much inflow can be stored, released, or delayed. | Initial pool elevation and outlet operation can change downstream timing and magnitude. |
| Channel geometry and roughness | Controls conveyance, water surface elevation, and velocity. | Incorrect Manning’s roughness or simplified cross sections can shift flood depths and mapped extents. |
| Bridges, culverts, levees, and obstructions | Local hydraulic controls can back water up or redirect flow. | Missing structures can make a model underestimate flood depth upstream of a restriction. |
| Drainage infrastructure condition | Blocked inlets, clogged culverts, failed gates, and sedimented channels reduce conveyance. | Maintenance condition can turn a moderate event into a local flooding problem. |
| Downstream boundary condition | Controls tailwater and how water exits the modeled reach. | High tailwater can worsen upstream flooding even if local rainfall is unchanged. |
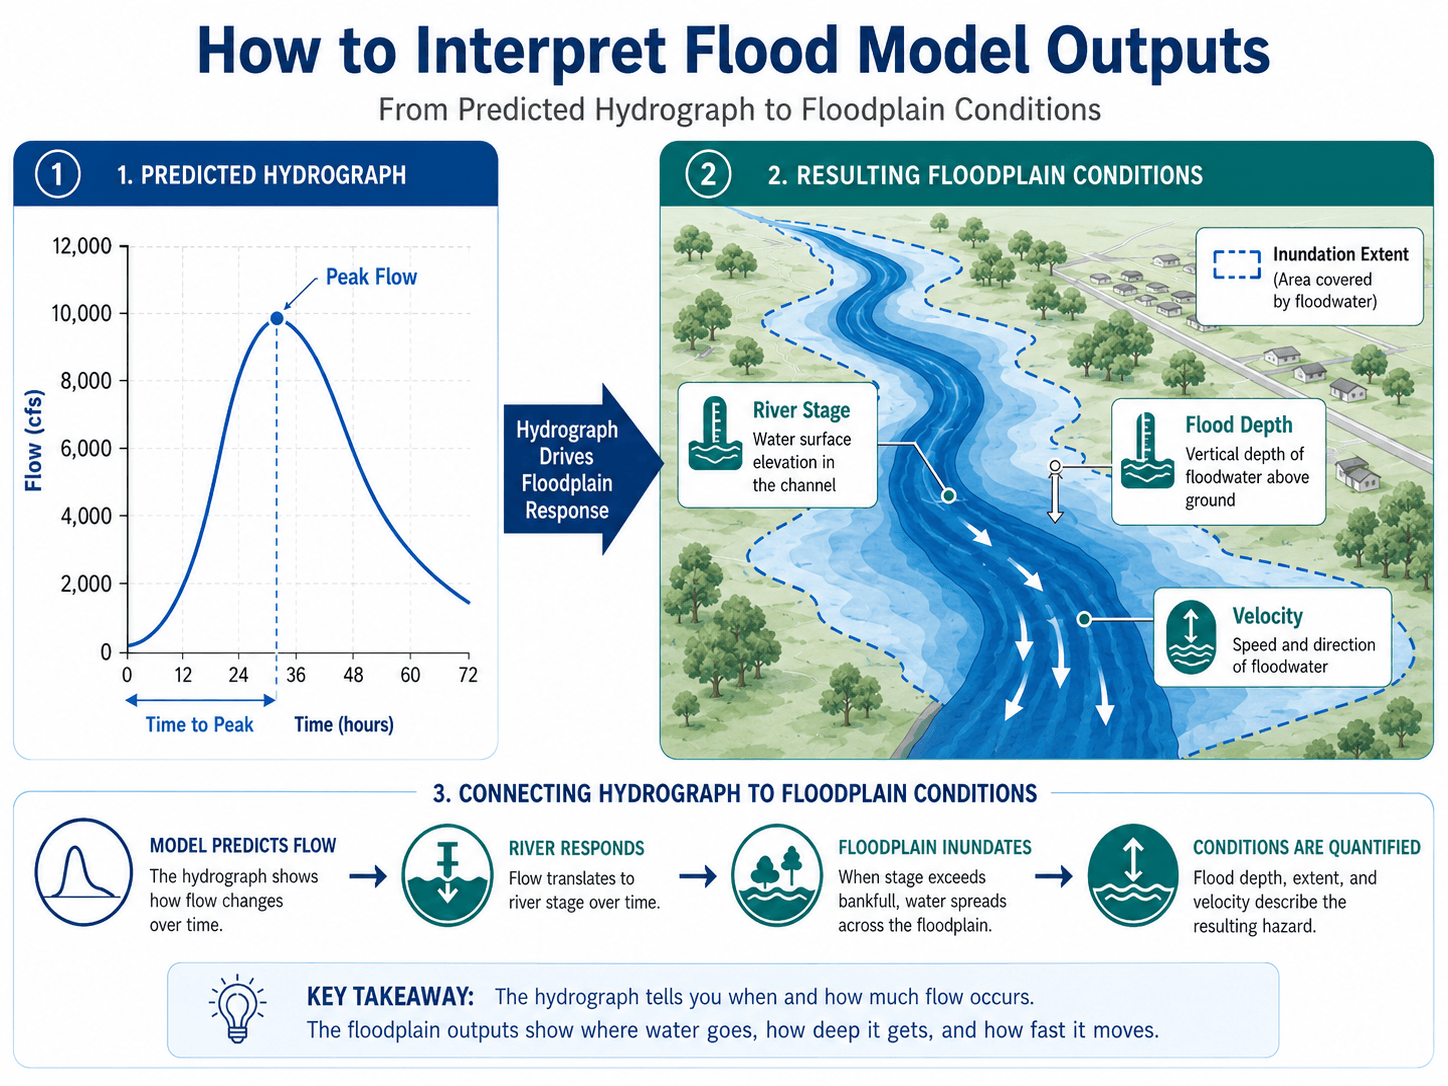
How to Interpret Flood Model Outputs
Flood model outputs should be interpreted as decision-support information, not as perfectly exact predictions. The most useful outputs connect a forecast hydrograph to floodplain conditions: when flow arrives, when it peaks, how long flooding may last, how high the river rises, where water spreads, how deep it gets, and how fast it moves.
| Model output | What it means | How engineers use it |
|---|---|---|
| Arrival time | When flood conditions are expected to begin at a location. | Used for road closures, evacuation timing, crew staging, and public messaging. |
| Peak discharge | The highest predicted flow rate during the event. | Used to evaluate channel capacity, bridge openings, culverts, and flood control features. |
| Time to peak | How long it takes the flood response to reach maximum flow or stage. | Used for warning lead time, road closure planning, and emergency staging. |
| River stage | The predicted water surface elevation at a gauge or location. | Used to compare against action, minor, moderate, and major flood thresholds. |
| Flood depth | The vertical depth of water above the ground surface. | Used for property impact, roadway passability, structure risk, and public safety planning. |
| Velocity | The speed and direction of floodwater movement. | Used to assess scour, erosion, debris transport, pedestrian danger, and structural loading. |
| Inundation extent | The mapped area predicted to be covered by floodwater. | Used for evacuation zones, floodplain planning, emergency maps, and risk communication. |
| Duration | How long floodwater may remain above a threshold or cover a location. | Used for closure duration, pump planning, access restoration, and damage assessment. |
| Probability of exceedance | The likelihood that stage, flow, depth, or rainfall will exceed a defined threshold. | Used to communicate uncertainty and decide whether to act before the forecast becomes certain. |
| Uncertainty band | The range of plausible outcomes based on forecast and model uncertainty. | Used to avoid overconfidence and plan for reasonable worst-case conditions. |
Uncertainty in Flood Predictive Modeling
Flood prediction is uncertain because the future storm, watershed response, infrastructure behavior, and field conditions are uncertain. A strong model does not hide that uncertainty. It communicates a reasonable range of outcomes and explains what could make the forecast better or worse.
| Uncertainty source | Example | How engineers manage it |
|---|---|---|
| Rainfall forecast | The storm cell shifts, stalls, intensifies, or misses the expected basin. | Use forecast updates, radar rainfall, multiple scenarios, and short-term nowcasting. |
| Initial watershed condition | Soils are more saturated than assumed because of previous rainfall. | Review antecedent rainfall, soil moisture, baseflow, and observed stream response. |
| Terrain accuracy | The DEM does not reflect new grading, roads, berms, buildings, or embankments. | Compare model terrain with recent LiDAR, survey data, as-built plans, and field observations. |
| Hydrologic parameters | Loss rates, unit hydrograph timing, storage, or routing assumptions are wrong. | Calibrate to historical events and test sensitivity to major hydrologic assumptions. |
| Hydraulic roughness | Vegetation, debris, seasonal growth, or channel condition differs from the model. | Review Manning’s roughness values, field photos, maintenance records, and sensitivity runs. |
| Infrastructure performance | A culvert clogs, a gate fails, a levee overtops, or storm drains surcharge. | Include known restrictions, inspect critical assets, and consider blockage or failure scenarios. |
| Communication uncertainty | A map boundary appears exact even though the forecast range is wide. | Use clear threshold language, scenario bands, and notes about model resolution and confidence. |
A flood forecast should usually be read as a decision range, not a single perfect line. If the forecast is close to a major threshold, engineers and emergency managers should review the next-worse scenario, not only the most likely scenario.
Flood Types That Change the Modeling Approach
A flood prediction workflow should match the flood mechanism. River flooding, urban ponding, coastal tailwater, and compound flooding can produce very different model requirements even when the final output is still a flood depth or inundation map.
| Flood type | Main modeling challenge | What to check |
|---|---|---|
| Fluvial flooding | River stage, channel capacity, overbank flow, and floodplain storage. | Streamgages, hydrographs, bridges, levees, roughness, tailwater, and inundation extent. |
| Pluvial flooding | Intense rainfall overwhelms local drainage before river flooding dominates. | Storm drains, inlets, low points, road crowns, urban storage, and short lead times. |
| Coastal flooding | Surge, tides, waves, and coastal water levels affect inland drainage and river outlets. | Tide levels, surge forecast, wind setup, outfall tailwater, and backwater effects. |
| Compound flooding | Multiple flood drivers occur together, such as river flow plus surge or local rainfall. | Downstream boundary conditions, timing overlap, drainage restrictions, and scenario combinations. |
| Dam or reservoir-related flooding | Storage, releases, spillway flow, breach assumptions, or operational constraints affect timing. | Reservoir stage, gate operations, inflow forecasts, emergency action thresholds, and downstream routing. |
Where Flood Predictive Modeling Is Used
Flood predictive modeling is used anywhere flood timing and severity affect decisions. The model output may support public warning, design review, floodplain management, transportation closures, reservoir operation, emergency response, insurance studies, or long-term resilience planning.
- Flood warning systems: forecast when river stage may exceed action, minor, moderate, or major flood thresholds.
- Flood risk assessment: connect predicted depths and extents to exposed buildings, roads, utilities, and critical facilities.
- Stormwater and urban flooding: evaluate how intense rainfall, impervious cover, storm drains, and detention systems affect local flooding.
- Bridge, culvert, and roadway review: estimate whether floodwater may overtop roads, backwater upstream, or create unsafe velocities.
- Reservoir and dam operations: estimate inflow timing and downstream response under forecast storm conditions.
- Emergency planning: support evacuation zones, road closures, sandbagging priorities, and field deployment timing.
The most useful flood prediction is often not the most visually detailed map; it is the forecast that gives decision-makers enough confidence and lead time to take the right action before conditions become unsafe.
Example: Turning a Rainfall Forecast into a Flood Warning Decision
A practical flood prediction does not stop at a modeled hydrograph. It connects forecast rainfall to a predicted river response, then compares that response with real warning thresholds and field conditions.
| Workflow step | Example modeled result | Engineering interpretation |
|---|---|---|
| Forecast rainfall | 4.5 inches over 12 hours, with heaviest rainfall over the upper watershed. | High runoff potential, especially if soils are already wet. |
| Initial watershed condition | Baseflow is elevated and soils are assumed near saturation. | Less rainfall will infiltrate, so runoff response may be faster and larger. |
| Hydrologic model output | Predicted peak discharge of 18,000 cfs with time to peak of about 16 hours. | The channel and bridge crossings should be checked against capacity and historical flood response. |
| Hydraulic model output | Predicted river stage of 14.8 ft and floodplain depth of 2 to 5 ft in low-lying areas. | Roads and low structures in the mapped inundation area may become unsafe. |
| Threshold comparison | Moderate flood stage begins at 14.0 ft. | The forecast exceeds the moderate threshold, so preparation and warning actions should begin before peak stage. |
| Operational decision | Close flood-prone road crossings, notify emergency management, and monitor gauge trend updates. | The model output becomes useful because it is tied to specific actions and timing. |
Why the threshold matters
A predicted stage of 14.8 ft means little unless it is compared with known impacts. If 14.0 ft corresponds to water near roads and 16.0 ft corresponds to structural impacts, the model output can be translated into staged response actions rather than a vague warning.
Flood Predictive Model QA/QC Checklist
A flood predictive model should be reviewed like an engineering decision tool. The checklist below focuses on the items most likely to change a prediction from useful to misleading.
Confirm the model purpose first, then review input data, terrain, hydraulic controls, calibration, validation, uncertainty, lead time, and action thresholds. A model built for flood warning may not be suitable for detailed floodplain design without additional review.
| Review check | What to look for | Why it matters |
|---|---|---|
| Model purpose | Is the model for real-time warning, planning, regulatory mapping, design, or emergency response? | Different purposes require different accuracy, resolution, calibration, and documentation. |
| Rainfall and forecast source | Check storm distribution, forecast update frequency, radar coverage, and observed rainfall comparison. | Rainfall uncertainty often dominates flood forecast uncertainty. |
| Streamgage comparison | Compare modeled stage and discharge to observed gauge behavior during previous and current events. | Gauge comparison is one of the fastest ways to see whether the model is tracking reality. |
| Terrain and floodplain data | Review DEM age, vertical accuracy, recent grading, new development, levees, and embankments. | Terrain errors can move flood boundaries, especially in flat floodplains. |
| Structures and restrictions | Confirm bridges, culverts, storm drain outfalls, levees, dams, gates, and known debris-prone locations. | Missing restrictions can underestimate backwater and overbank flooding. |
| Roughness assumptions | Review channel and floodplain roughness values for vegetation, development, debris, and seasonal conditions. | Roughness affects depth, velocity, and timing, especially during overbank flow. |
| Boundary conditions | Check downstream water level, tailwater, coastal influence, reservoir levels, or confluence effects. | A poor boundary condition can distort results throughout the modeled reach. |
| Calibration and validation | Confirm whether the model was adjusted to observed events and tested against separate events. | A model that only fits one event may not be reliable for the next storm. |
| Forecast lead time | Check whether the forecast arrives early enough for closures, warnings, evacuations, or field deployment. | Accurate predictions are less useful if they arrive too late for action. |
| Communication threshold | Check whether the output is tied to action, minor, moderate, major, or site-specific impact levels. | Forecasts must translate into operational decisions, not just charts and maps. |
| Warning thresholds | Check whether modeled stage, depth, or extent is tied to clear action levels. | Prediction is most valuable when it leads to a specific operational decision. |
Engineering Judgment and Field Reality
Flood prediction models simplify real systems. They may represent a river channel, floodplain, or watershed with impressive detail, but they still depend on assumptions about rainfall, terrain, roughness, infiltration, drainage infrastructure, flow restrictions, and downstream conditions.
Experienced engineers look for the field conditions that are easy to miss in a clean model: blocked culverts, debris at bridges, beaver dams, temporary construction, sedimented channels, dense vegetation, failed flap gates, undersized storm drains, saturated detention basins, road embankments that redirect flow, and low driveways that create local flow paths.
A model may show a smooth floodplain boundary, but real floodwater follows curbs, ditches, fences, road crowns, clogged inlets, low lots, and small topographic breaks that may not be fully captured at the model scale.
When Flood Predictive Modeling Breaks Down
Flood predictive modeling breaks down when the model is used outside its assumptions, when key data is missing, or when real field conditions change faster than the model can represent. This is especially important during flash flooding, urban flooding, compound flooding, debris-heavy events, and storms that fall outside the calibration record.
- Rainfall forecast error: the storm may shift, intensify, stall, or weaken in a way the model did not anticipate.
- Gauge gaps: ungauged tributaries and sparse sensor networks can hide fast local flood response.
- Outdated terrain: new development, grading, berms, roads, and drainage modifications may not exist in the model terrain.
- Blocked conveyance: debris, sediment, ice, or vegetation can reduce bridge, culvert, and channel capacity.
- Urban drainage limits: storm drains, inlets, and minor systems can surcharge before river flooding becomes the main issue.
- Compound flooding: river flooding, coastal surge, high tailwater, reservoir releases, and local rainfall can interact in ways a simple model may not capture.
- Changing watershed conditions: historical calibration may not represent future conditions when rainfall intensity, land use, channel maintenance, or floodplain development has changed.
- False precision: a flood boundary drawn to the nearest foot may imply more accuracy than the rainfall, terrain, and model assumptions can support.
Common Mistakes and Practical Checks
The most common mistakes in flood predictive modeling come from treating a forecast map as a precise answer instead of a conditional estimate. The model is a decision-support tool, not a guarantee that water will follow a perfect boundary line.
| Common mistake | Why it causes problems | Practical check |
|---|---|---|
| Treating the inundation edge as exact | The boundary depends on terrain accuracy, model resolution, and forecast uncertainty. | Review uncertainty, elevation data, and known field observations near critical assets. |
| Confusing mapping with forecasting | A static floodplain map does not necessarily predict timing for a specific storm. | Check whether the output includes forecast rainfall, lead time, stage trend, and threshold timing. |
| Ignoring blocked structures | Backwater can be underestimated when debris, sediment, or vegetation reduces conveyance. | Inspect bridges, culverts, trash racks, and known debris accumulation points. |
| Using old terrain | New grading, roads, berms, and development can change local flood pathways. | Compare the DEM against recent LiDAR, survey, as-built plans, and field photos. |
| Skipping validation | The model may look reasonable but fail to match actual flood behavior. | Compare to high-water marks, streamgage records, historical flood extents, and local reports. |
| Ignoring forecast lead time | A technically accurate forecast may not support real action if it comes too late. | Compare predicted arrival time with the time needed for closures, warnings, or evacuation. |
Do not assume the edge of a modeled inundation polygon is an exact field boundary. It is better understood as a forecast estimate that should be interpreted with terrain accuracy, model resolution, and uncertainty in mind.
Flood Prediction Data Sources and Technical References
Flood predictive modeling often combines public forecast data, field observations, hydraulic modeling, and flood inundation mapping. Engineers commonly compare modeled results with observed streamgage behavior, historical events, and local flood records before using predictions for planning or response.
- USGS flood inundation mapping: USGS flood inundation mapping and real-time streamgage data is useful because it shows how streamgage information, inundation map libraries, and National Weather Service forecasts can be connected into practical flood warning and community response workflows.
- Project-specific criteria: local floodplain regulations, emergency action plans, stormwater manuals, dam safety requirements, and owner criteria may control how model output is applied.
- Engineering use: the reference data is most useful when it is combined with local terrain, field observations, calibrated models, and clearly defined action thresholds.
Frequently Asked Questions
Flood predictive modeling is the use of rainfall forecasts, streamgage data, watershed response, terrain, hydraulic controls, historical flood records, and sometimes machine learning to estimate when flooding may occur, where water may spread, and how severe conditions may become.
Flood predictive modeling is the broader technical process used to estimate future flood behavior, while flood forecasting is the operational use of those models and real-time data to predict upcoming river stage, discharge, timing, and warning thresholds.
Common inputs include rainfall forecasts, observed precipitation, streamgage stage and discharge, watershed boundaries, soil moisture, land use, terrain or DEM data, channel geometry, bridges, culverts, roughness assumptions, downstream boundary conditions, forecast lead time, and historical flood records.
Hydrologic flood modeling estimates how rainfall becomes runoff and streamflow over time, while hydraulic modeling estimates how that flow moves through channels and floodplains to produce water surface elevations, flood depths, velocities, and inundation extents.
Machine learning can improve rapid prediction, pattern recognition, and probabilistic warning tools when enough reliable training data is available, but it still needs calibration, validation, physical review, and engineering judgment. It should not be treated as automatically better than hydrologic or hydraulic modeling.
Flood models can fail when rainfall forecasts are wrong, streamgage data is sparse, terrain data is outdated, culverts or bridges are missing, roughness assumptions are poor, debris blocks a flow path, storm drains surcharge, land use changes, or the model is applied outside the conditions used for calibration.
Summary and Next Steps
Flood predictive modeling uses data, models, and engineering judgment to estimate how a flood may develop before or during an event. The strongest models connect rainfall, runoff, streamflow, terrain, hydraulics, uncertainty, and warning thresholds into a workflow that supports decisions.
The key is interpretation. Arrival time, peak flow, time to peak, river stage, flood depth, velocity, inundation extent, duration, and probability all matter. A useful prediction should be checked against observed data, field conditions, hydraulic controls, and the specific action the model is meant to support.
Where to go next
Continue your learning path with related Turn2Engineering resources.
-
Hydrology
Learn how rainfall, runoff, infiltration, streamflow, and watershed response form the foundation of flood prediction.
-
Flood Risk Assessment
See how flood hazards, exposure, likelihood, and consequences are evaluated for communities and infrastructure.
-
Water Resources Modeling
Explore how engineers use models to simulate watersheds, rivers, stormwater systems, groundwater, storage, and flood scenarios.