Key Takeaways
- Core idea: Tolerance stack up analysis checks how part and feature tolerances combine to affect one critical assembly requirement.
- Engineering use: Mechanical designers use stack ups to protect gaps, clearances, preload, alignment, hole patterns, seal compression, and functional fits.
- What controls it: The result depends on the functional requirement, stack path, datum scheme, sign convention, method choice, and manufacturing capability.
- Practical check: A tolerance stack is only useful when the calculation matches the real assembly, inspection setup, GD&T controls, and production process.
Table of Contents
Introduction
Tolerance stack up analysis is the process of calculating how part and feature tolerances accumulate across an assembly to affect a critical gap, clearance, interference, alignment, or fit. Mechanical designers use it to verify function before release, choose realistic tolerances, and avoid costly assembly problems in production.
Tolerance Stack Loop Diagram
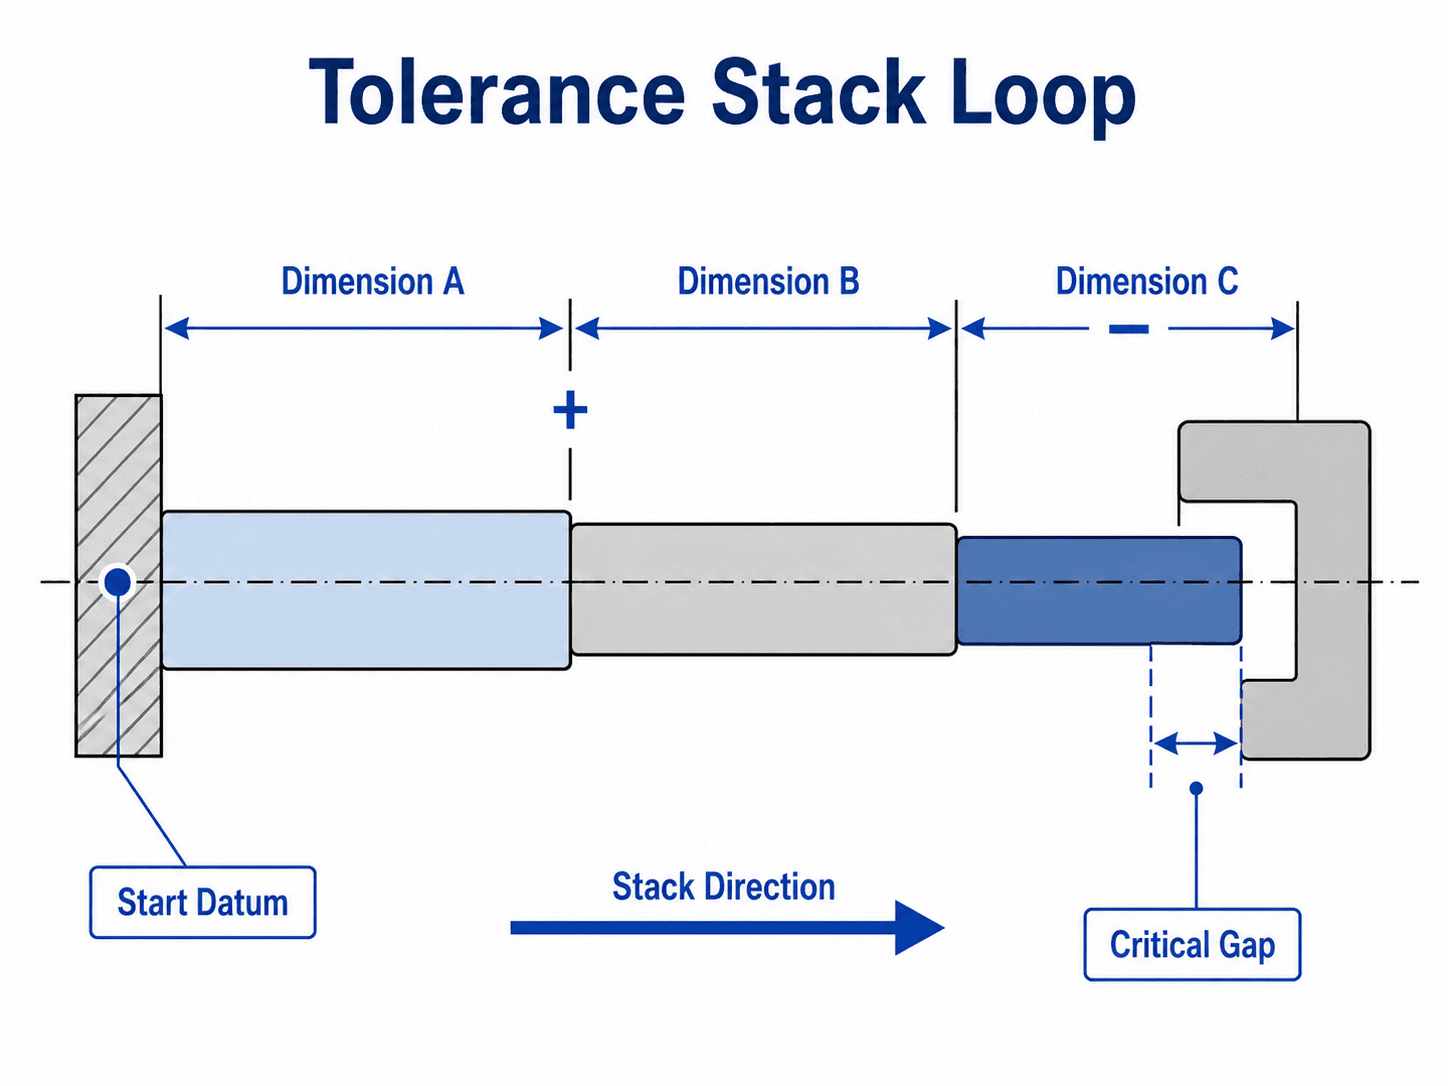
Notice that the analysis is not built by adding every dimension on a drawing. It follows the dimensions that actually control the requirement being checked.
What Is Tolerance Stack Up Analysis?
Tolerance stack up analysis is a mechanical design method used to predict how manufacturing variation in individual parts affects an assembly-level requirement. The requirement may be a minimum clearance, maximum interference, bearing endplay, seal compression, fastener alignment, gear mesh position, enclosure gap, or any other dimension that controls whether the assembly works.
A tolerance stack up is often the assembly-level part of a broader tolerance analysis. Tolerance analysis can include GD&T interpretation, statistical modeling, process capability, inspection strategy, and simulation. The stack up itself is the path of contributors that produces a specific functional output.
Start every stack up by writing the functional requirement in plain language: “The minimum gap between these two faces must be at least 0.25 mm,” or “The shaft endplay must remain between 0.05 mm and 0.20 mm.”
Tolerance Stack Up Inputs and Outputs
A useful tolerance stack converts drawing information and assembly assumptions into an engineering decision. The inputs describe the parts and controls. The output tells the designer whether a functional requirement is protected.
| Input or output | Example | Why it matters |
|---|---|---|
| Functional requirement | Minimum gap, shaft endplay, bolt clearance, seal compression, or hole alignment | Defines the output that the stack must prove or improve. |
| Nominal dimensions | Housing depth, spacer length, shoulder location, cover offset | Defines the nominal assembly condition before tolerance variation is applied. |
| Dimensional tolerances | ±0.10 mm, +0.05/-0.00 mm, or limit dimensions | Controls the minimum and maximum contribution of each dimension. |
| GD&T controls | Position, profile, flatness, perpendicularity, runout, MMC, or LMC | Controls feature location, orientation, form, and material-condition behavior beyond simple plus-minus dimensions. |
| Datum scheme | Datum A/B/C used for feature location and inspection | Defines the reference frame for both design intent and measurement. |
| Stack result | Minimum gap, maximum interference, predicted distribution, or yield estimate | Supports the design decision: pass, redesign, tighten a tolerance, change datums, add adjustment, or improve the process. |
When Mechanical Designers Use Tolerance Stack Ups
Tolerance stack up analysis is most useful when several part dimensions combine to control one assembly outcome. It is especially important before drawings are released, tooling is purchased, or production suppliers are locked into a tolerance scheme that may be expensive to change later.
| Mechanical design situation | Critical requirement being protected | Why a stack up matters |
|---|---|---|
| Shaft, bearing, spacer, and retaining ring assembly | Endplay, preload, or axial clamp condition | Small tolerance changes across shoulders, spacers, snap rings, and housings can change a free-running bearing into a preloaded or loose assembly. |
| Bolted brackets or mating hole patterns | Fastener alignment and assembly clearance | Hole location variation can make parts difficult to assemble even when each individual part appears to be within tolerance. |
| Plastic, cast, or sheet metal enclosures | Visible gap, flushness, and latch engagement | Cosmetic and functional gaps often depend on several molded, formed, and assembled features that vary together. |
| Seals, gaskets, and compression interfaces | Minimum and maximum compression | Too little compression can leak; too much compression can damage the seal or increase assembly force. |
| Sliding parts, rails, linkages, and mechanisms | Clearance, travel, binding risk, or lost motion | The functional motion depends on accumulated dimensional variation, alignment, wear, and assembly sequence. |
A stack up is also a cost-control tool. It helps the mechanical designer explain which dimensions are function-critical and which tolerances can be relaxed without harming assembly performance.
The Basic Tolerance Stack Up Workflow
A reliable tolerance stack up starts with the functional output, not the drawing. The designer identifies the requirement, traces the physical stack loop, assigns signs to each contributor, calculates the output range, and then decides whether the design has enough margin.
1. Define the Functional Requirement
The functional requirement is the output being checked. Examples include minimum gap, maximum interference, shaft endplay, hole misalignment, seal squeeze, or latch engagement. Without this requirement, the stack up has no pass/fail target.
2. Trace the Stack Loop
The stack loop moves from a starting reference, through the contributing dimensions, to the final controlled feature. The loop should match the real assembly path. Dimensions that do not affect the requirement should be left out.
3. Assign Direction and Sign
Some dimensions increase the output and others reduce it. This is why signed dimensions matter. For a gap analysis, one part length may make the gap larger while another shoulder or spacer length may make the gap smaller.
4. Calculate the Range or Distribution
Worst-case analysis calculates the minimum and maximum possible output from drawing limits. Statistical methods such as RSS and Monte Carlo estimate the likely distribution of outputs when variation is treated probabilistically.
5. Compare Against the Requirement
The final result must be interpreted as a design decision. If the stack fails, the answer is not always “tighten every tolerance.” Often the better fix is to change the datum scheme, remove a contributor, add adjustability, or tighten only the dimension that controls the requirement most strongly.
What Dimensions Belong in the Stack?
The most common tolerance stack up mistake is including dimensions that do not control the functional requirement or missing dimensions that do. A valid stack follows the real physical path between the reference feature and the controlled output.
| Include in the stack | Usually exclude | Reason |
|---|---|---|
| Dimensions on the physical path from the datum or reference feature to the controlled gap, fit, or alignment. | Cosmetic dimensions that do not affect the functional output. | The stack should answer one functional question, not summarize the entire drawing. |
| Feature locations that control mating part alignment, fastener clearance, or contact surfaces. | Duplicate dimensions that describe the same feature more than once. | Duplicate contributors can double-count variation and make the stack look worse than it is. |
| GD&T controls that affect the interface, such as position, profile, flatness, perpendicularity, or runout. | Reference dimensions that are not used as toleranced design controls. | GD&T may control the functional condition more directly than a plus-minus dimension. |
| Coatings, washers, shims, seals, gaskets, snap rings, and spacers when they affect the output. | Features outside the assembly load path or motion path. | Small non-machined contributors can dominate a tight stack if they are physically in the gap path. |
| Assembly conditions such as seating faces, locating pins, press fits, and clamp sequence when they define final position. | Manufacturing setup dimensions that do not remain functional in the assembly. | The stack should reflect assembled function, not only how an individual part was made. |
If removing a dimension from the model would not change the functional gap, clearance, or alignment being checked, it probably does not belong in that stack.
Worst-Case, RSS, and Monte Carlo Tolerance Analysis
The three common approaches are worst-case, RSS, and Monte Carlo. Each answers a different design question. Worst-case asks whether the assembly will work at all tolerance extremes. RSS asks what the likely variation is under statistical assumptions. Monte Carlo simulates many possible assemblies using input distributions.
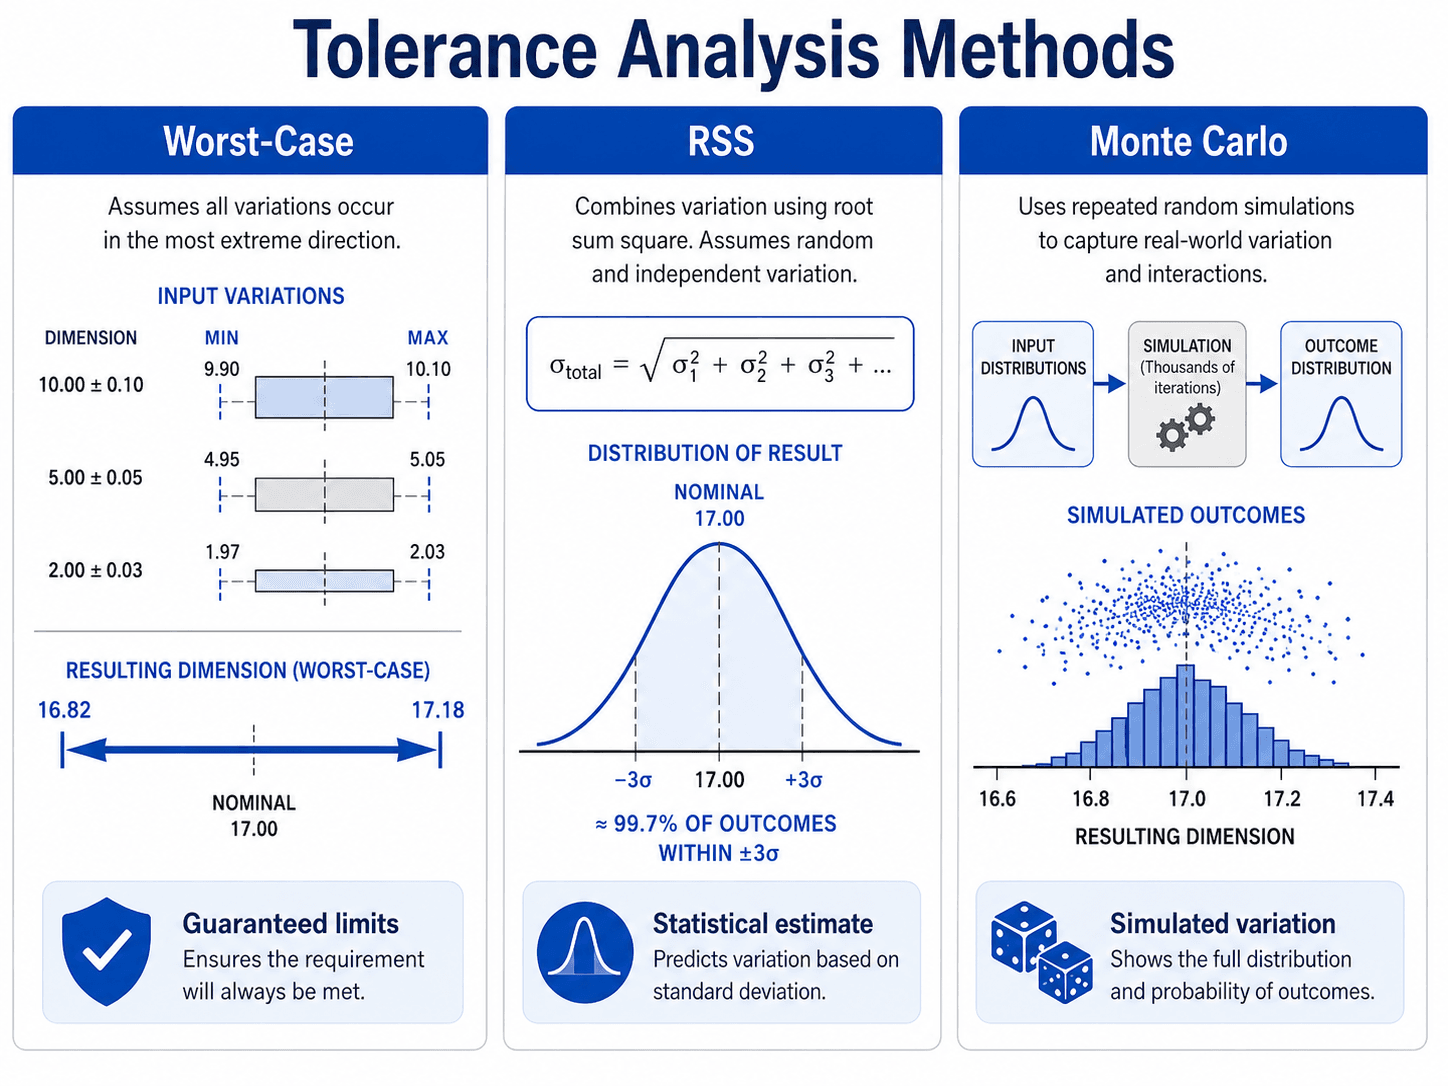
In a worst-case stack, the total tolerance is the sum of the absolute contributing tolerances. This is conservative because it assumes every dimension is at its most unfavorable limit at the same time.
RSS combines contributors using the root-sum-square method. It is useful when variation sources are independent and process behavior supports a statistical assumption. RSS is a probability model, not a drawing requirement, and it should not be used as a shortcut to make a failing worst-case stack appear acceptable.
- \(T_i\) Tolerance contribution from one dimension or feature, commonly in mm or inches.
- \(T_{\text{worst}}\) Total worst-case tolerance range contribution for the stack output.
- \(T_{\text{RSS}}\) Estimated statistical tolerance contribution when the RSS assumptions are appropriate.
- \(G_{\min}\) Minimum gap or clearance after the unfavorable tolerance combination is applied.
Method Selection Table
| Design situation | Recommended method | Why |
|---|---|---|
| Safety-critical, no-fail, or very low-volume assembly | Worst-case first | Every possible build condition may matter, and statistical acceptance may not be enough. |
| Early concept design with unknown suppliers | Worst-case or conservative assumptions | Process capability, centering, and distribution behavior are not yet proven. |
| High-volume product with stable process data | RSS or Monte Carlo | Assembly yield can be estimated statistically when contributors are well understood. |
| Nonlinear 2D or 3D geometry | Monte Carlo or dedicated tolerance analysis software | Simple 1D equations may miss angular, positional, and interaction effects. |
| Supplier process is biased or drifting | Worst-case or adjusted statistical model | A process can be within tolerance but still centered too close to one limit. |
Why RSS Depends on Process Capability
RSS assumes the variation contributors behave statistically and are independent enough to combine as random variables. In production, that assumption should be checked against process capability, process centering, measurement data, and supplier history.
Cp and Cpk are useful concepts because they separate tolerance width from process centering. A process can have enough theoretical spread capability but still be biased toward one limit. If a process is drifting, correlated, or poorly centered, an RSS stack may predict better assembly yield than the line actually produces.
1D vs 2D vs 3D Tolerance Stack Ups
Many beginner examples are 1D because linear stacks are easier to explain. Real mechanical assemblies often require 2D or 3D thinking when angular error, true position, profile, or part deformation changes the final interface.
| Stack type | What it handles | Typical mechanical design use |
|---|---|---|
| 1D tolerance stack | Linear contributors along one axis | Shaft endplay, spacer stacks, bearing shoulder locations, enclosure gaps, seal compression, and axial clearances. |
| 2D tolerance stack | X/Y location, angular effects, and planar feature relationships | Hole patterns, bracket alignment, pin clearance, linkage geometry, slotted holes, and mating plates. |
| 3D tolerance analysis | Full spatial variation, datum systems, feature orientation, and assembly interactions | Complex castings, molded housings, optical alignment, multi-part mechanisms, and assemblies where CAD-based simulation is more appropriate. |
A simple tolerance stack up calculator or spreadsheet can be useful once the stack path is defined, but the tool is only as accurate as the model, signs, datums, contributors, and assumptions behind it.
Tolerance Stack Up Analysis Example
Consider a simple 1D assembly gap. A housing depth, spacer length, and cover offset combine to determine a final clearance gap. The design requirement is:
Assume the nominal stack is:
| Contributor | Nominal value | Tolerance | Effect on gap |
|---|---|---|---|
| Housing depth | 25.00 mm | ±0.10 mm | Increases gap |
| Spacer length | 18.00 mm | ±0.08 mm | Reduces gap |
| Cover offset | 6.50 mm | ±0.05 mm | Reduces gap |
The nominal gap is:
For the worst-case minimum gap, use the smallest housing depth and the largest spacer and cover offset:
The result barely passes the 0.25 mm minimum gap requirement. Because the margin is only 0.02 mm, the designer should not immediately assume the design is robust. The next step is to identify the dominant contributor. In this example, the housing depth tolerance contributes ±0.10 mm, so increasing the nominal gap or tightening the housing depth may provide more value than tightening every component.
Do not report only the nominal gap. The nominal value may look healthy while the minimum gap fails once tolerances are applied.
How GD&T Changes Tolerance Stack Up Analysis
GD&T can change the stack because features are controlled relative to datums, basic dimensions, and tolerance zones instead of only chain dimensions. This is important for hole patterns, machined faces, brackets, castings, molded parts, and assemblies where function depends on location or orientation.
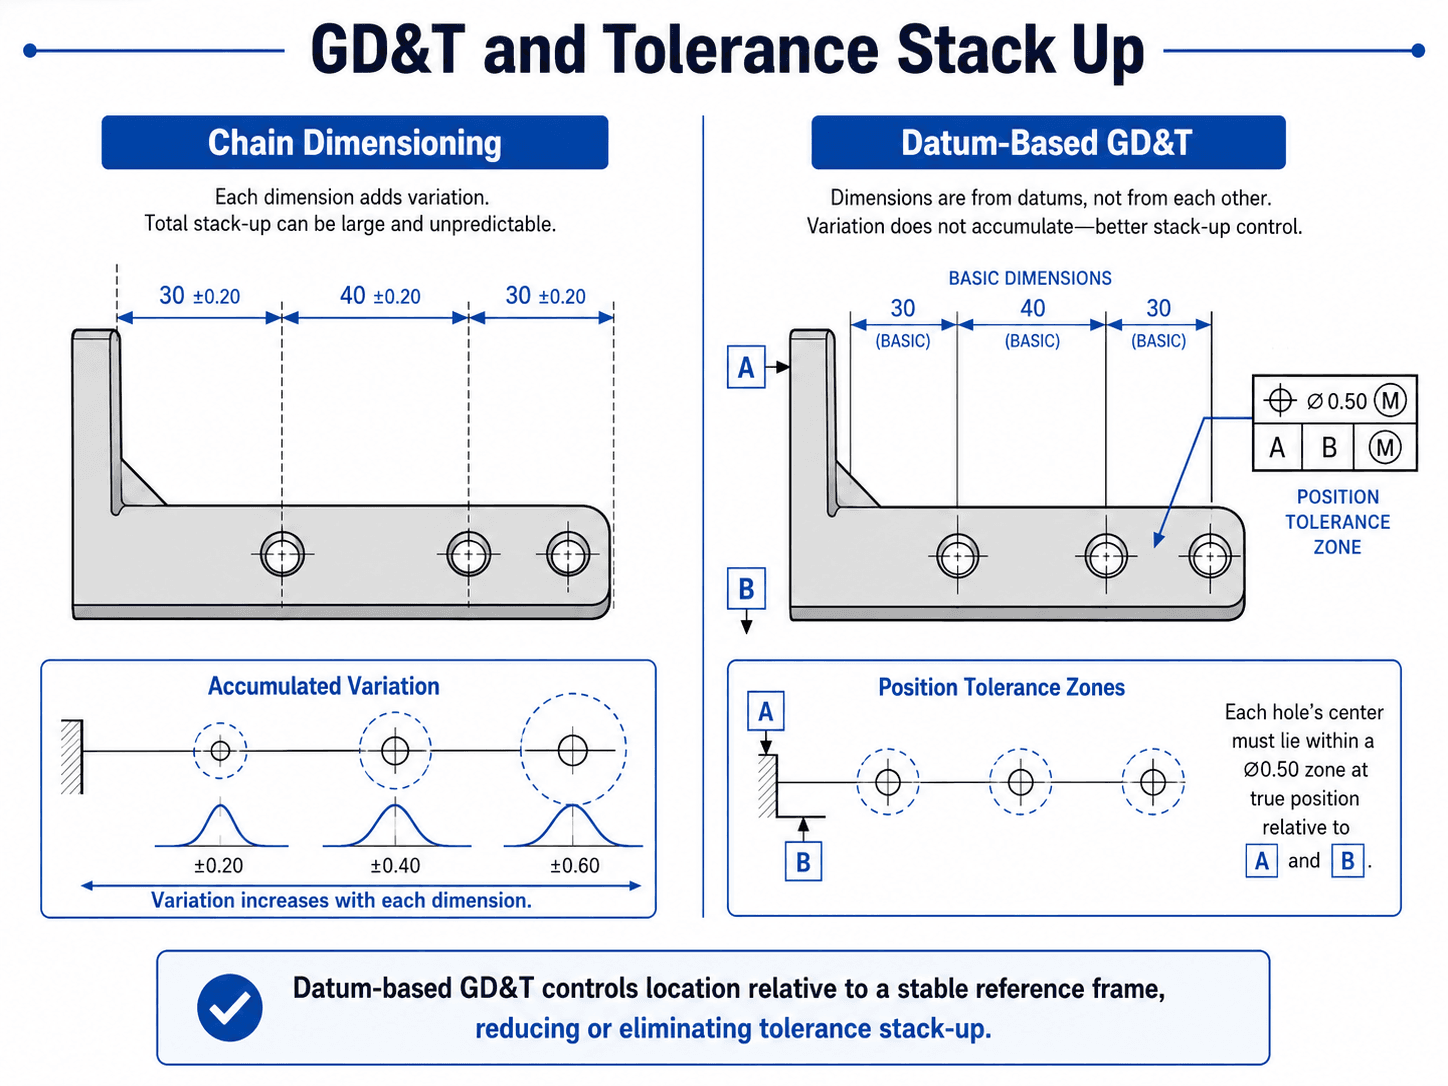
Datums and Basic Dimensions
A datum reference frame defines how a part is located for design intent and inspection. Basic dimensions describe the theoretically exact location of features relative to those datums, while the tolerance zone defines how much variation is allowed. If the datum scheme changes, the stack changes.
Position Tolerance and Hole Alignment
For bolt holes, pins, and locating features, position tolerance often gives a clearer functional control than a chain of plus-minus dimensions. However, the tolerance stack must still account for actual feature size, material modifiers, mating part tolerances, fastener clearance, and inspection method.
MMC, LMC, and Bonus Tolerance
Maximum material condition and least material condition can change available assembly clearance. Bonus tolerance may improve assembly probability, but it must be calculated from actual feature size and applied consistently with the drawing requirement.
When Form and Orientation Controls Belong in the Stack
Flatness, perpendicularity, parallelism, runout, and profile do not automatically belong in every stack, but they must be considered when they affect the functional interface. Flatness can change a mating gap, perpendicularity can shift a shoulder-to-face relationship, runout can affect rotating assemblies, and profile can control molded or cast surfaces that contact another part.
Senior Engineer Tolerance Stack Review Checklist
A tolerance stack should be reviewed like a design decision, not just a spreadsheet. The checklist below helps catch the errors that commonly survive early calculations.
Define the requirement, trace the physical stack loop, assign signs, choose a method, calculate the result, compare against the functional limit, then decide whether to change geometry, datum structure, tolerance allocation, manufacturing process, or inspection approach.
| Review check | What to look for | Why it matters |
|---|---|---|
| Functional requirement is explicit | The stack defines a specific gap, clearance, interference, alignment, or endplay limit. | A stack without a clear output cannot produce a meaningful pass/fail decision. |
| Stack path follows the assembly | The dimensions form a physical loop from datum or reference feature to the controlled feature. | Including irrelevant dimensions or missing a real contributor can invalidate the result. |
| Signs are correct | Each contributor is marked as increasing or decreasing the output. | A single sign error can turn a conservative stack into a false pass. |
| GD&T is interpreted correctly | Datum references, basic dimensions, position tolerance, profile, form, MMC, LMC, and bonus tolerance are handled intentionally. | GD&T controls variation differently than simple plus-minus coordinate dimensions. |
| Method matches risk | Worst-case is used for guaranteed fit; RSS or Monte Carlo is used only when assumptions are justified. | Statistical methods estimate probability, not absolute assembly guarantee. |
| Process capability supports the model | Supplier data, process centering, Cp/Cpk, measurement history, and correlation risks are reviewed. | A statistical stack can fail in production if the real process is biased or unstable. |
| Inspection matches design intent | The measurement setup uses the same datums and feature definitions assumed in the stack. | A stack can pass analytically while shop-floor inspection evaluates the feature differently. |
| Margin is realistic | The design has allowance for process drift, thermal change, coatings, wear, load deflection, and measurement uncertainty. | A tiny numerical pass may still fail in production when real-world effects are included. |
What to Do When a Tolerance Stack Fails
A failed stack does not automatically mean every contributor needs a tighter tolerance. Tightening all dimensions can increase machining cost, inspection burden, scrap, supplier risk, and lead time without addressing the real design weakness.
| Corrective option | When it helps | Tradeoff |
|---|---|---|
| Change the geometry | The nominal gap or clearance is too small even before tolerances are applied. | May require design changes but often creates the cleanest margin. |
| Change the datum scheme | The stack is inflated by chain dimensions or inconsistent references. | Requires drawing discipline and agreement with manufacturing and inspection teams. |
| Tighten only the dominant contributor | One feature contributes most of the stack variation. | Can reduce cost compared with tightening every dimension. |
| Add adjustability or shims | The design must absorb large variation or field adjustment is acceptable. | Adds parts, labor, and potential assembly error. |
| Improve process capability | The tolerance is reasonable but the current manufacturing process cannot hold it reliably. | May require tooling, fixture, supplier, or inspection changes. |
| Use selective assembly | High-volume or high-precision assemblies can be grouped by measured size. | Increases production control complexity and inventory handling. |
Good mechanical design usually balances dimensional margin, manufacturing cost, inspection clarity, and assembly robustness. The best correction is the one that improves function without creating unnecessary precision elsewhere.
Common Misconceptions About Tolerance Stack Ups
Tolerance stack up analysis is often misunderstood because the math looks simple. The engineering judgment is in defining the right model and interpreting what the result actually means.
| Misconception | Better interpretation |
|---|---|
| If every part is in tolerance, the assembly will work. | Individual part compliance does not guarantee the assembled requirement passes at the system level. |
| RSS is always more realistic than worst-case. | RSS is useful only when the statistical assumptions match the process and contributors are reasonably independent. |
| GD&T eliminates tolerance stack up. | GD&T can reduce ambiguity and improve functional control, but variation still exists and must be interpreted correctly. |
| A tolerance stack is just adding tolerances. | A valid stack follows a physical loop tied to one functional requirement and includes only relevant contributors. |
| A passing spreadsheet means the design is ready. | The result still needs review for measurement uncertainty, assembly sequence, thermal effects, supplier capability, and field behavior. |
Engineering Judgment and Field Reality
Real assemblies are affected by more than drawing tolerances. Surface finish, coatings, plating thickness, burrs, press fits, bearing seating, torque sequence, fixture distortion, temperature, load deflection, material creep, and supplier process drift can all change the functional result.
Inspection is another practical issue. If design assumes one datum structure but the supplier measures from a convenient shop-floor edge, the part can appear acceptable while the assembly function is not controlled. The tolerance analysis, drawing, inspection plan, and manufacturing process should all describe the same design intent.
A stack up that passes by 0.01 mm is not automatically a good design. Small margins can disappear once gage repeatability, fixture seating, thermal expansion, plating, burrs, and assembly force are included.
When This Breaks Down
Simplified tolerance stack up analysis becomes less reliable when the model no longer represents the real assembly behavior. This is common when geometry is multi-dimensional, parts deform under load, dimensions are correlated, or GD&T is simplified into a plus-minus value without understanding the tolerance zone.
- 2D and 3D geometry: Angular error, true position, profile, perpendicularity, and runout can create vector effects that a simple 1D stack cannot capture.
- Correlated dimensions: Features made in the same setup may shift together instead of varying independently, which can make RSS assumptions invalid.
- Process bias: A process centered near one tolerance limit can produce worse real results than a centered statistical model predicts.
- Flexible parts: Sheet metal, plastic, seals, springs, and thin brackets may deform during assembly, changing the functional gap or alignment.
- Unmodeled contributors: Coatings, weld distortion, casting draft, tool wear, burrs, and measurement uncertainty may dominate a tight stack.
Common Tolerance Stack Up Mistakes
Most stack-up errors are not advanced math errors. They are model-definition errors: wrong stack path, wrong sign, wrong datum, missing contributor, or using a statistical method without the data to support it.
- Adding every dimension on the drawing: Only dimensions that affect the functional requirement belong in the stack.
- Ignoring signs: Some dimensions increase the output and others reduce it; treating all contributors as positive can misrepresent the result.
- Mixing datum schemes: A stack based on inconsistent references may not match how the part is manufactured or inspected.
- Using RSS without process justification: RSS assumes independent variation and reasonable statistical behavior.
- Forgetting assembly sequence: Fastener torque, seating order, press fit sequence, and locating features can determine the final condition.
- Confusing drawing tolerance with process capability: A supplier may not be centered or capable just because the drawing allows a range.
The most dangerous tolerance stack is one that is mathematically clean but physically wrong. Always review the stack loop against the actual parts, datums, and assembly sequence.
Useful Standards and Design References
Tolerance stack up analysis depends heavily on how dimensions, datums, and GD&T requirements are stated on drawings and models. For GD&T terminology and drawing interpretation, ASME Y14.5 is the key reference family used across many mechanical design organizations.
- ASME Y14.5 Dimensioning and Tolerancing: ASME Y14.5 dimensioning and tolerancing standard covers GD&T symbols, rules, definitions, requirements, defaults, and recommended practices used to state and interpret geometric requirements on drawings and digital product definitions.
- Project-specific requirements: Company drawing standards, supplier quality requirements, inspection plans, and customer specifications may define how tolerance analysis is documented and approved.
- Engineering use: Designers use the standard context to avoid ambiguous drawings, align inspection with design intent, and prevent stack-up assumptions from conflicting with GD&T controls.
Frequently Asked Questions
Tolerance stack up analysis is the process of calculating how dimensional and geometric tolerances combine across parts in an assembly. Engineers use it to check whether a critical gap, clearance, interference, alignment, or fit will still meet the functional requirement after manufacturing variation is included.
Worst-case analysis adds the most unfavorable tolerance limits and is used when the assembly must work even if every contributor is at its extreme limit. RSS analysis combines independent variation statistically, usually producing a less conservative estimate, but it depends on distribution, independence, and process capability assumptions.
GD&T affects tolerance stack up analysis by controlling features relative to datums, basic dimensions, and tolerance zones instead of only chaining plus-minus dimensions. A good datum scheme can reduce ambiguous accumulation, but position, profile, MMC, form controls, and inspection setup must be interpreted correctly.
A tolerance stack up should be done when accumulated variation can affect assembly function, such as a bearing preload, shaft endplay, seal compression, hole alignment, fastener fit, enclosure gap, sliding clearance, or interference condition. It is most valuable before drawings are released or tooling is committed.
A worst-case tolerance stack can support a guaranteed fit if the stack path, dimensions, tolerances, datum scheme, and assumptions are correct. Statistical methods such as RSS or Monte Carlo estimate probability or yield instead of guaranteeing every possible assembly condition.
Summary and Next Steps
Tolerance stack up analysis connects mechanical drawings to real assembly function. It shows whether accumulated manufacturing variation still allows the product to meet a critical gap, clearance, interference, alignment, or motion requirement.
The strongest stack ups begin with a clear functional requirement, follow the physical stack loop, use the right calculation method, and account for GD&T, inspection, manufacturing capability, and real assembly behavior. When a stack fails, the best answer is often better design intent or tolerance allocation, not simply tighter dimensions everywhere.
Where to go next
Continue your learning path with related Turn2Engineering resources.
-
Mechanical Design
Review the broader mechanical design workflow that connects requirements, geometry, tolerances, manufacturing, and product function.
-
Design Process
See how tolerance analysis fits into the larger process of defining, developing, validating, and refining mechanical products.
-
Stress Analysis
Review how load, deformation, and structural behavior can affect clearances and functional fits in mechanical assemblies.