
Direct Answer
Power system efficiency is the percentage of input electrical power that is delivered as useful output across a defined system boundary. Losses occur in conductors, transformers, cables, substations, converters, motors, and other equipment, with resistive \(I^2R\) losses, transformer no-load and load losses, reactive-current flow, harmonics, and phase imbalance among the most important causes.
The basic efficiency formula is useful only when the boundary and operating condition are clearly defined. A transformer, feeder, transmission corridor, industrial facility, and complete transmission-and-distribution system can all have different efficiency values and different dominant loss mechanisms.
Where Power Losses Occur in a Power System
Electrical losses accumulate from the source to the final load. The dominant loss source depends on voltage level, current, conductor length, transformer loading, system topology, waveform quality, and the boundary being studied.
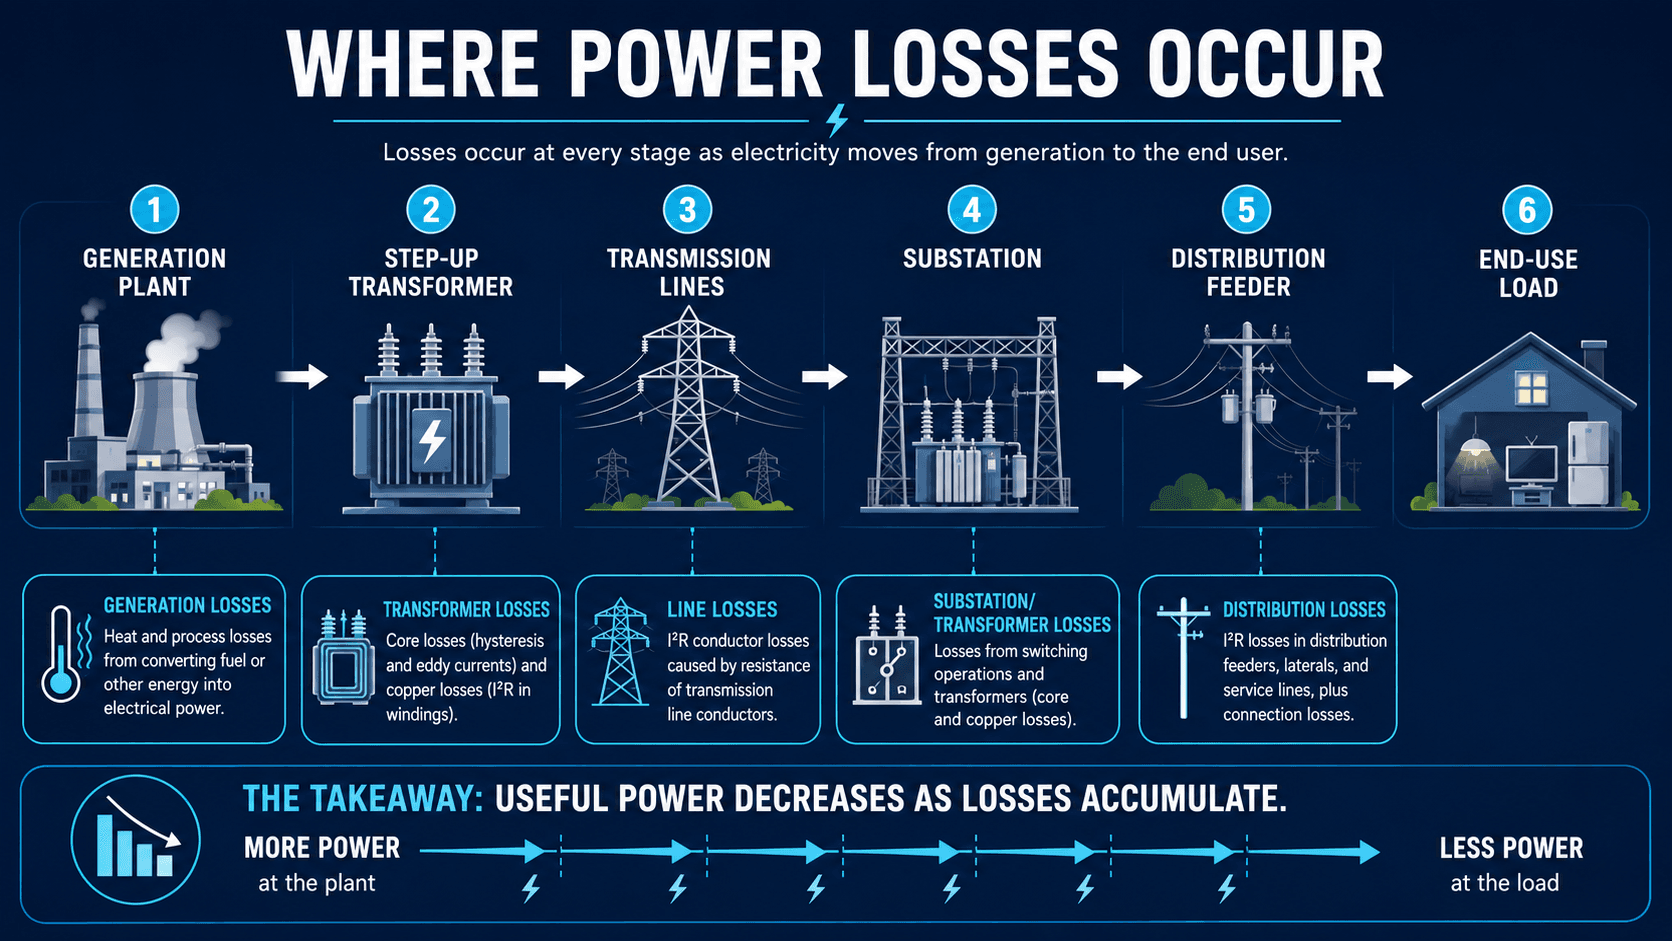
| Loss mechanism | Where it occurs | What controls it |
|---|---|---|
| Conductor \(I^2R\) loss | Lines, cables, buswork, feeders, windings | Current, resistance, conductor temperature, length |
| Transformer no-load loss | Transformer core | Core material, voltage, frequency, energized hours |
| Transformer load loss | Windings and stray-load paths | Load current, winding resistance, eddy/stray effects |
| Reactive-current loss | Lines, transformers, motors, inductive systems | Power factor, reactive-power flow, voltage support |
| Harmonic loss | Transformers, conductors, neutrals, motors | Nonlinear loads, harmonic spectrum, system impedance |
| Phase-imbalance loss | Three-phase feeders and equipment | Uneven phase loading, neutral current, unbalanced voltage |
| Non-technical loss | Utility metering and energy accounting | Metering error, unaccounted energy, unauthorized use, data quality |
Swipe horizontally to view all table columns.
For U.S. grid-level context, EIA estimates that annual transmission and distribution losses averaged about 5% of electricity transmitted and distributed during 2018–2022. EIA also explains how those losses are calculated relative to grid-delivered electricity: EIA — Transmission and Distribution Losses.
Power System Efficiency Formula and Core Loss Equations
Efficiency is a boundary calculation. Input and useful output must refer to the same operating condition and the same segment of the system.
Efficiency
Power Loss
Resistive Loss
- \(\eta\)Efficiency, usually expressed as a percentage.
- \(P_{\text{in}}\)Power entering the defined boundary.
- \(P_{\text{out}}\)Useful power leaving the boundary.
- \(I\)Current through the conductor or winding.
- \(R\)Effective resistance over the relevant path and temperature.
A transformer efficiency, feeder efficiency, and complete grid efficiency are different metrics. Define the measurement boundary before interpreting the percentage.
Transformer Efficiency: No-Load Losses vs. Load Losses
Transformer efficiency changes with loading because core losses exist whenever the transformer is energized while winding-related load losses increase strongly with current.
| Loss type | Behavior | Engineering implication |
|---|---|---|
| No-load / core loss | Roughly present whenever the transformer is energized | Matters heavily for lightly loaded or continuously energized units |
| Load / winding loss | Increases approximately with current squared | Becomes more important as transformer loading rises |
| Stray and auxiliary losses | Depend on design, cooling, eddy currents, and accessories | Can matter in large or highly loaded transformers |
Swipe horizontally to view all table columns.
DOE’s distribution-transformer rulemaking describes no-load losses as existing whenever the transformer is energized and load losses as increasing with percent loading. DOE also notes that typical distribution transformers are already above 98% efficient, yet even small improvements matter because the equipment operates continuously and in very large numbers. citeturn509682search36turn509682search38
DOE’s amended federal efficiency standards for distribution transformers took effect in 2024, with compliance required for covered products manufactured on or after April 23, 2029. citeturn509682search0
Oversizing is not always more efficient. A transformer that spends most of its life lightly loaded can incur unnecessary no-load losses, while an overloaded transformer increases load losses and thermal stress.
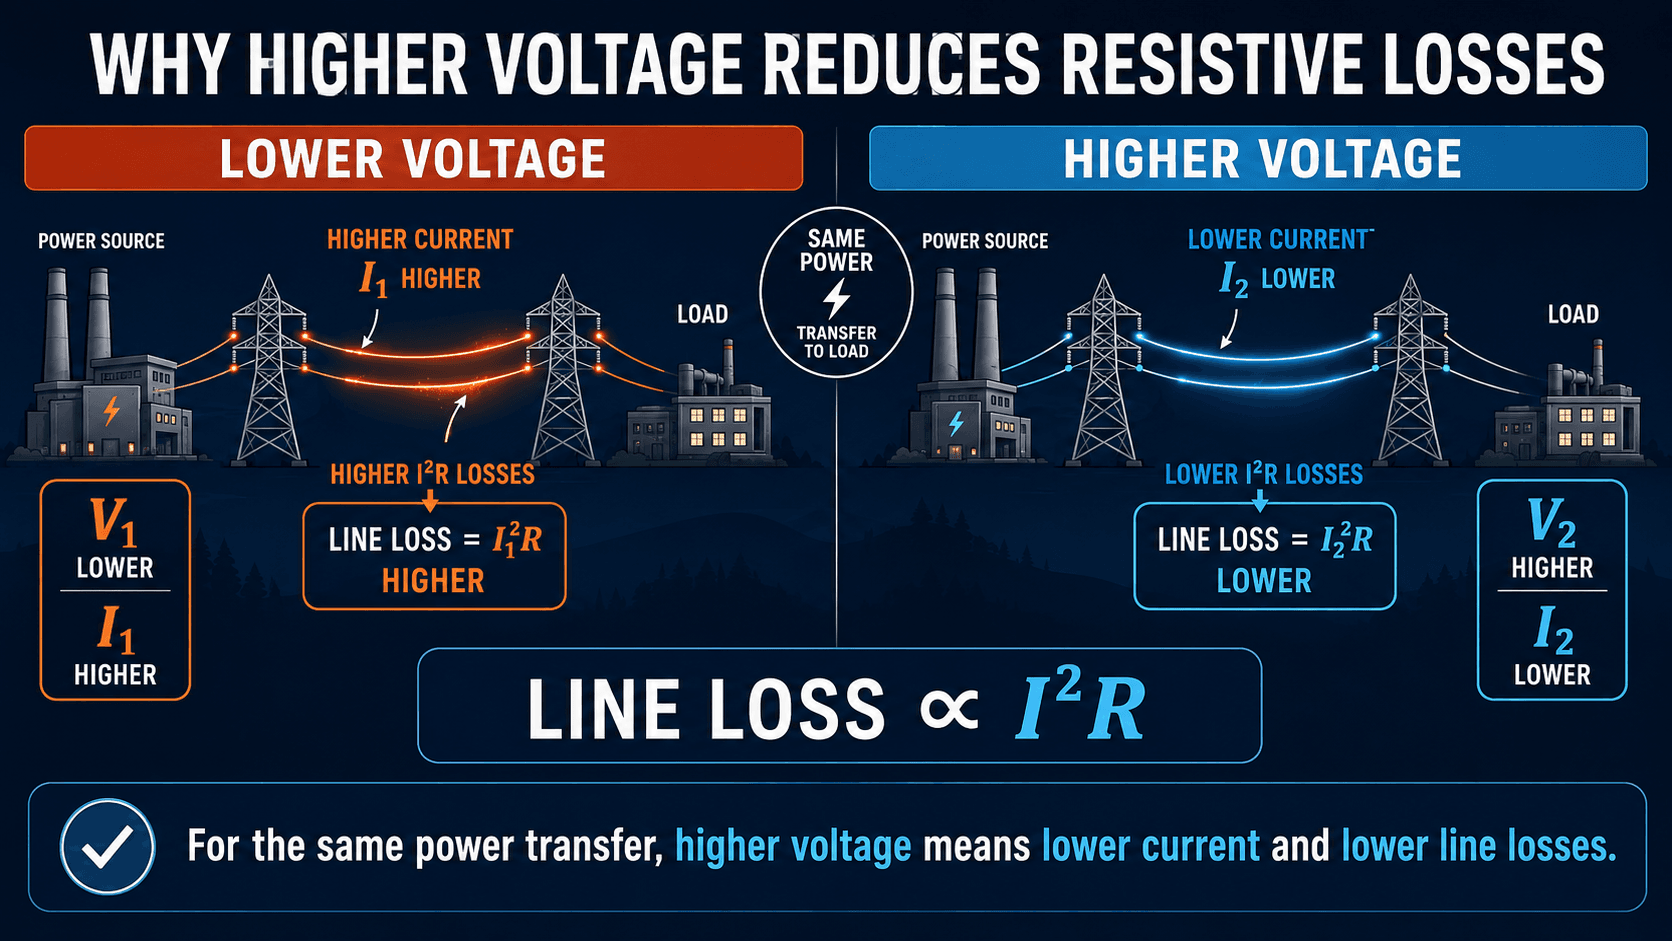
Why Higher Voltage and Better Power Factor Reduce Losses
For the same real-power transfer, raising voltage or improving power factor reduces current. Because conductor and winding losses scale with \(I^2\), even moderate current reduction can create large loss reduction.
Three-Phase Real Power
If \(P\) is fixed, current falls when either \(V_{LL}\) or power factor increases. That frees equipment capacity and reduces \(I^2R\) loss.
Current Reduction Example
If current is reduced from 200 A to 100 A through the same resistance:
Engineering meaning: Halving current cuts the resistive loss to 25% of the original value—a 75% reduction—if resistance is unchanged.
For dedicated treatment of reactive current and capacitor/inverter strategies, see Power Factor Correction.
Transmission Losses vs. Distribution Losses
Transmission and distribution losses share many physical mechanisms, but their dominant drivers differ because transmission operates at much higher voltage while distribution uses more branches, lower voltages, and many service transformers.
| Segment | Main loss drivers | Common efficiency actions |
|---|---|---|
| Transmission | Long distance, conductor resistance, reactive flow, high transfer, transformer losses, corona in some applications | Higher voltage, conductor upgrades, reactive compensation, redispatch, topology changes |
| Subtransmission | Regional transfer, intermediate voltage, transformers, variable loading | Voltage optimization, transformer/loading review, network reinforcement |
| Distribution | Lower voltage, higher current, radial length, phase imbalance, service transformers | Feeder balancing, reconductoring, voltage optimization, transformer upgrades, capacitor placement |
| Facility distribution | Motors, drives, transformers, low power factor, harmonics, oversized equipment | Motor/system optimization, PF correction, harmonic mitigation, transformer/load management |
Swipe horizontally to view all table columns.
EIA’s long-run U.S. benchmark of roughly 5% T&D losses is useful for broad context, but it should not be used as a target for an individual feeder, transformer, or facility because the measurement boundary and system characteristics are different. citeturn664652search0
How Harmonics, Unbalance, and Power Quality Affect Efficiency
Efficiency calculations based only on fundamental-frequency real power can miss additional heating caused by distorted or unbalanced current.
| Condition | Efficiency effect | What to check |
|---|---|---|
| Harmonic current | Raises RMS current and can increase winding, stray, conductor, and neutral losses | THD, harmonic spectrum, transformer loading, neutral current |
| Phase imbalance | Creates unequal losses and can increase neutral current and motor losses | Phase currents, voltage unbalance, single-phase load allocation |
| Low voltage | Some loads draw more current to deliver the required power | Voltage profile, taps, conductor drop, motor behavior |
| Poor power factor | Increases current without increasing useful real power | kW, kVAR, kVA, power factor, capacitor/inverter controls |
Swipe horizontally to view all table columns.
For waveform distortion, harmonic limits, and measurement strategy, see Power Quality.
How Engineers Evaluate Power System Efficiency
Efficiency analysis combines measurements, equipment data, and network models. The goal is to locate the dominant loss mechanisms and determine whether correcting them is technically and economically justified.
- Define the boundary.
Choose the transformer, feeder, substation, facility, corridor, or full system being evaluated.
- Measure or estimate input and output.
Use synchronized metering, SCADA, interval data, or a validated engineering model.
- Separate loss mechanisms.
Identify conductor, transformer, reactive, harmonic, imbalance, and non-technical components.
- Run realistic operating cases.
Review peak, light-load, seasonal, future, and contingency conditions where relevant.
- Test improvement options.
Compare conductor changes, transformer sizing, PF correction, voltage optimization, topology changes, and controls.
- Compare lifecycle value.
Balance energy savings against capital cost, outage cost, reliability, maintainability, and equipment life.
Using Load Flow Analysis
Load Flow Analysis is the primary system-level tool for comparing real and reactive flows, bus voltages, line/transformer loading, and modeled losses under different operating conditions.
Worked Efficiency Example
If a feeder receives 10.0 MW and delivers 9.55 MW to its downstream loads under the same steady operating condition:
The 95.5% value is valid only for the defined feeder boundary and operating point. Annual energy efficiency requires interval or energy data over the period being evaluated.
How Engineers Improve Power System Efficiency
The best efficiency projects reduce the dominant loss mechanism without creating new voltage, protection, reliability, harmonic, or maintenance problems.
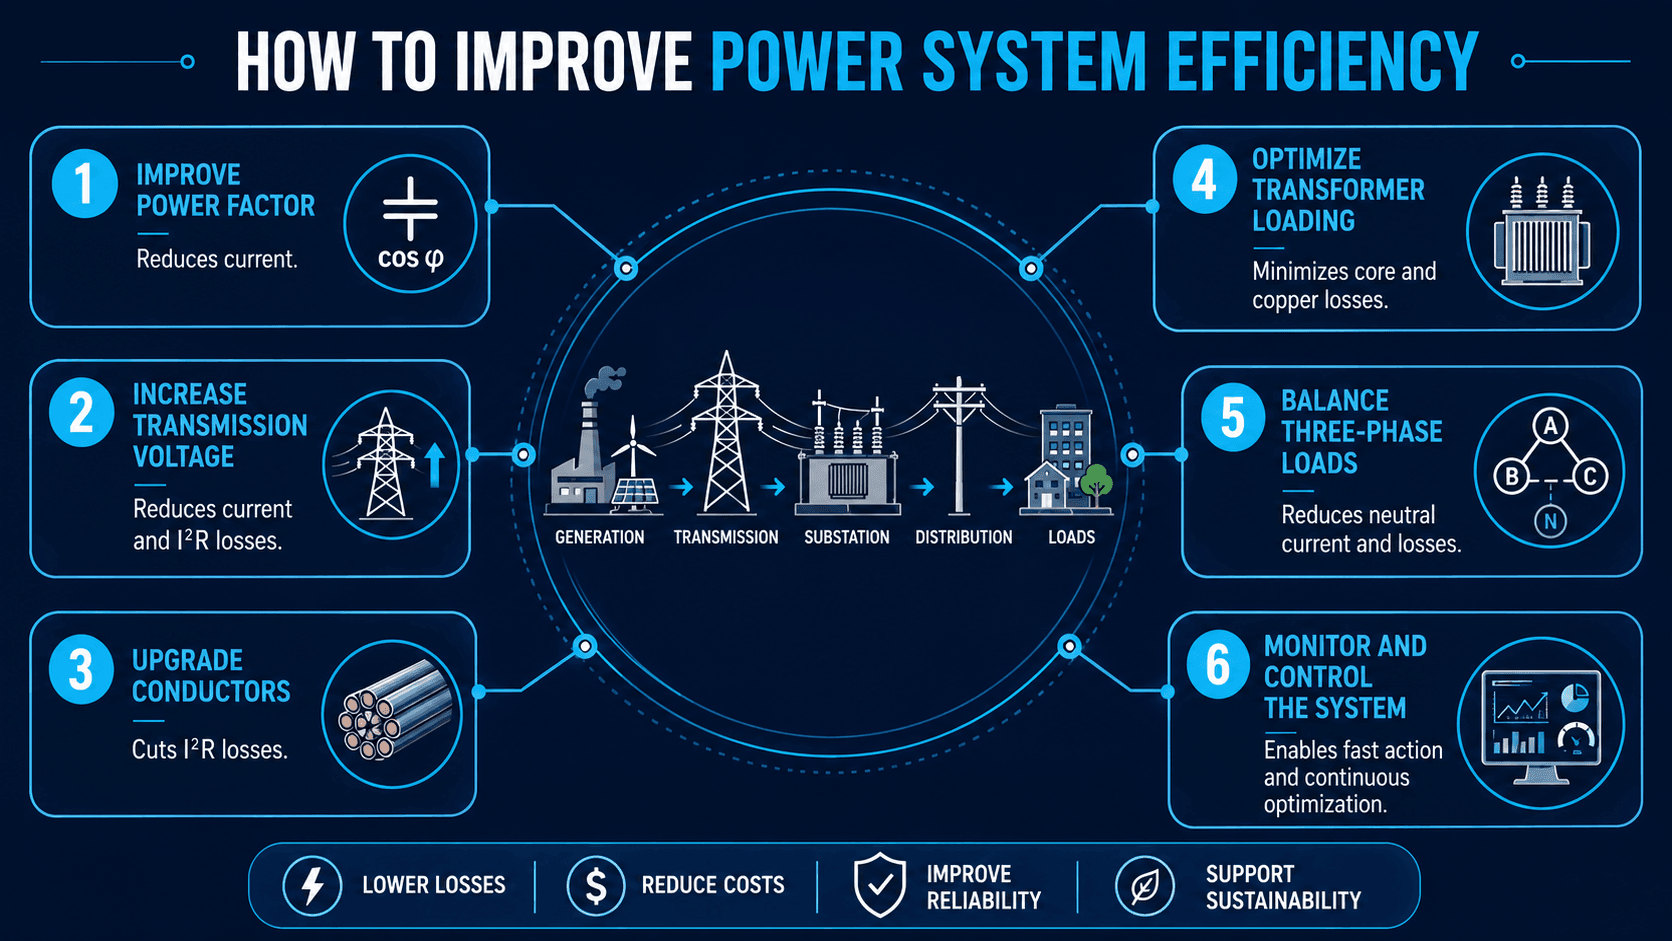
| Improvement | Targets | Critical tradeoff |
|---|---|---|
| Improve power factor | Reactive current and feeder/transformer loading | Overvoltage, switching, harmonics, resonance |
| Increase voltage where justified | Current and resistive loss | Insulation, equipment, clearances, capital cost |
| Upgrade conductors | Resistance, voltage drop, thermal margin | Material, outage, route, installation cost |
| Optimize transformers | No-load and load loss balance | Load profile, redundancy, growth, replacement cost |
| Balance phases | Unequal current and neutral loss | Operational switching and load distribution |
| Reduce harmonic current | Extra RMS current and heating | Filter design, resonance, nonlinear load behavior |
| Optimize topology / dispatch | High-loss flow paths | Reliability, contingency limits, operating complexity |
| Improve monitoring | Unknown or hidden losses | Meter accuracy, data quality, model calibration |
Swipe horizontally to view all table columns.
DOE’s 2024 distribution-transformer standards illustrate why small efficiency improvements can matter at scale: transformers operate continuously, and DOE estimated the amended standards would produce substantial lifetime energy savings and billions of dollars in benefits. citeturn509682search1
Do not optimize only for the lowest theoretical loss. The best project must also satisfy voltage, protection, reliability, capacity, maintenance, and lifecycle-cost requirements.
Power System Efficiency Engineering References
Efficiency studies use different data and standards depending on whether the boundary is a transformer, facility, feeder, transmission system, or utility network.
- U.S. Energy Information Administration — Transmission and Distribution Losses U.S. grid-level T&D loss context and the calculation basis used by EIA.
- U.S. Department of Energy — Distribution Transformers Federal transformer efficiency requirements and current standards activity.
- IEEE 3002.2-2018 — Load-Flow Studies Steady-state power-flow and voltage analysis used to evaluate network loading and losses.
Frequently Asked Questions
What is power system efficiency?
Power system efficiency is the ratio of useful electrical power delivered across a defined system boundary to the electrical power supplied to that boundary, expressed as a percentage.
What is the formula for power system efficiency?
The basic formula is \(\eta=P_{\text{out}}/P_{\text{in}}\times100\%\). The input and output must be measured or calculated over the same boundary and operating condition.
Why does higher voltage reduce power losses?
For the same real-power transfer, higher voltage allows lower current. Since resistive losses vary with current squared, lower current can substantially reduce conductor and winding losses.
How does power factor affect efficiency?
Low power factor increases current for the same real power. The extra current raises \(I^2R\) losses, consumes transformer and feeder capacity, and can worsen voltage drop.
What are the biggest power-system losses?
The dominant losses depend on the system boundary, but common contributors include conductor \(I^2R\) losses, transformer no-load and load losses, reactive-current flow, harmonics, phase imbalance, and distribution feeder losses.
What percentage of electricity is lost in U.S. transmission and distribution?
EIA estimates that annual U.S. transmission and distribution losses averaged about 5% of electricity transmitted and distributed during 2018–2022. That is a broad grid-level benchmark, not a target for every feeder or facility.
Summary and Next Step
Power system efficiency measures how much input electrical power reaches the intended output after losses within a defined boundary. The largest controllable losses are often tied to current, resistance, transformer loading, reactive power, power factor, phase imbalance, and harmonic distortion.
Strong efficiency work defines the boundary, validates the data, separates loss mechanisms, evaluates multiple operating conditions, and compares improvement options against lifecycle cost and reliability—not just the lowest theoretical loss.