
Table of Contents
Introduction
A psychrometric chart is a graphical representation of moist-air properties at a specified atmospheric pressure. Plot two independent properties—commonly dry-bulb temperature and relative humidity—to locate one air-state point, then read humidity ratio, dew point, wet-bulb temperature, enthalpy, and specific volume from the lines passing through that point.
HVAC engineers and technicians use the chart to visualize sensible heating, sensible cooling, cooling with dehumidification, humidification, evaporative cooling, reheat, air mixing, and cooling-coil operation. The correct HVAC term is psychrometric chart; “psychometric chart” is a common misspelling.
For calculated values instead of visual interpolation, use the Psychrometric Calculator. It is especially useful when pressure, altitude, unit conversions, or greater numerical precision matter.
Key Takeaways
- Start with two properties: Two independent moist-air properties and the applicable atmospheric pressure define the air state.
- Use the correct chart: Psychrometric relationships change with barometric pressure, so altitude and pressure matter.
- Read one line family at a time: Dry bulb, humidity ratio, relative humidity, wet bulb, enthalpy, dew point, and specific volume each use a different axis, curve, or line direction.
- Follow process direction: The movement between entering and leaving state points shows whether temperature, moisture content, or both changed.
- Verify important results: Use the psychrometric calculator when a hand-read estimate is not precise enough.
How to Read a Psychrometric Chart
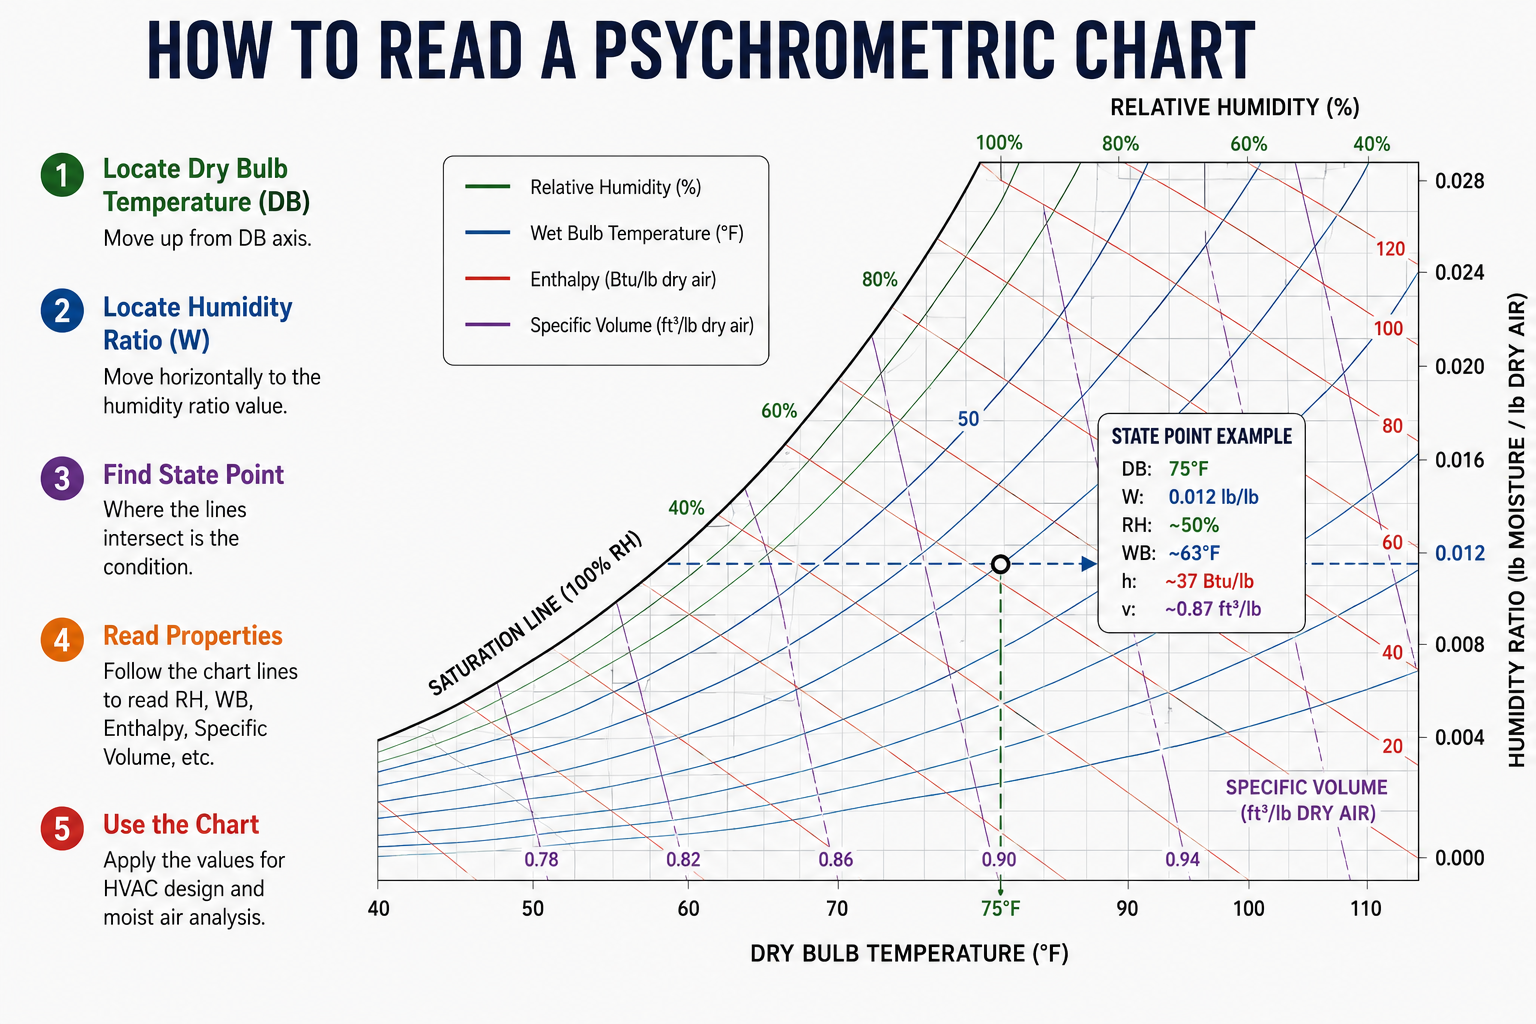
The chart appears complicated because several property families share one graph. The reliable method is to isolate one line family at a time rather than trying to interpret the entire chart at once.
Psychrometric Chart Quick Start
For the most common chart-reading task, begin with dry-bulb temperature and relative humidity.
- Confirm pressure and units: Check whether the chart is for sea level or another pressure and whether it uses I-P or SI units.
- Find dry-bulb temperature: Locate the temperature on the bottom scale and follow its constant-temperature line upward.
- Find relative humidity: Identify the curved relative-humidity line for the known percentage.
- Mark the state point: The intersection of the two lines represents the air condition.
- Read the remaining properties: Follow the appropriate line or scale for humidity ratio, dew point, wet bulb, enthalpy, and specific volume.
- Check the result: Enter the same known properties in the Psychrometric Calculator when you need a calculated value or want to verify your visual reading.
Verify the chart legend. Publishers may use different line colors, scale locations, units, and graphical layouts even though the underlying psychrometric relationships are the same.
Psychrometric Chart Lines and Properties
A psychrometric chart combines the thermodynamic properties of a dry-air and water-vapor mixture on one graph. The standard chart region is bounded by the saturation curve, a lower dry-air boundary, and the selected temperature and humidity-ratio limits.
Dry-Bulb Temperature
Dry-bulb temperature is the ordinary air temperature measured by a properly shielded thermometer. Values are shown along the lower horizontal scale. Constant dry-bulb lines extend upward through the chart and may be vertical or slightly inclined depending on the chart coordinate system.
Dry-bulb temperature primarily represents the sensible-temperature condition of the air. Moving right generally means warmer air; moving left generally means cooler air.
Humidity Ratio
Humidity ratio, commonly represented by \(W\), is the mass of water vapor per unit mass of dry air. It may be expressed as lb water/lb dry air, grains water/lb dry air, kg water/kg dry air, or g water/kg dry air.
Constant humidity-ratio lines run horizontally. The scale is normally printed on the right side of the chart. A higher state point has more water vapor per unit mass of dry air than a lower state point.
Relative Humidity
Relative humidity compares the actual water-vapor pressure with the saturation vapor pressure at the same dry-bulb temperature. Constant-relative-humidity lines curve upward across the chart and are labeled as percentages.
Relative humidity does not directly measure the mass of moisture in the air. If air is sensibly heated without adding moisture, humidity ratio remains constant while relative humidity decreases.
Saturation Curve
The upper-left curved boundary is the 100% relative-humidity line, also called the saturation curve. At saturation, dry-bulb temperature, thermodynamic wet-bulb temperature, and dew-point temperature are equal.
Ordinary unsaturated air states appear below and to the right of the saturation curve. A point plotted beyond the saturation boundary indicates an input, unit, pressure, or line-reading error for a single-phase moist-air condition.
Wet-Bulb Temperature
Thermodynamic wet-bulb temperature is associated with an ideal adiabatic saturation process. Constant wet-bulb lines slope diagonally downward from left to right and are typically read where they intersect a labeled scale or the saturation boundary.
Wet-bulb temperature is lower than or equal to dry-bulb temperature for unsaturated air. The difference between dry bulb and wet bulb is sometimes called wet-bulb depression.
Dew-Point Temperature
Dew point is the temperature at which the existing water-vapor content reaches saturation when the air is cooled at constant pressure without adding or removing moisture.
To find dew point, move horizontally left from the state point along the constant humidity-ratio line until it reaches the saturation curve. Read the temperature at that intersection.
Enthalpy
Moist-air enthalpy, represented by \(h\), combines sensible and latent energy per unit mass of dry air. Enthalpy lines slope diagonally across the chart and are read from the applicable enthalpy scale.
Wet-bulb and enthalpy lines may appear nearly parallel, but they are not exactly the same property and should not automatically be treated as identical. Follow the line family and scale identified by the chart publisher.
Specific Volume
Specific volume, represented by \(v\), is the volume occupied by the moist-air mixture per unit mass of dry air. Its diagonal lines are useful when converting between volumetric airflow and dry-air mass flow.
Specific volume is the reciprocal of dry-air-basis density when the definitions and units are consistent. It changes appreciably with temperature and barometric pressure.
How to Identify Each Chart Property
Use this reference to determine which axis, curve, or diagonal line should be followed from a plotted state point.
| Property | Chart Appearance | Reading Method | Common Error |
|---|---|---|---|
| Dry-bulb temperature | Bottom scale; constant-temperature lines extend upward | Trace from the state point to the bottom temperature scale | Following a wet-bulb or enthalpy diagonal instead |
| Humidity ratio | Right-side scale; horizontal constant-moisture lines | Move horizontally from the state point to the right scale | Confusing lb/lb, grains/lb, and g/kg |
| Relative humidity | Curved percentage lines below the saturation curve | Identify or interpolate the RH curve through the state point | Treating RH as the actual mass of moisture |
| Dew point | Temperature at the saturation curve at constant humidity ratio | Move horizontally left to the saturation boundary | Moving diagonally or vertically |
| Wet-bulb temperature | Diagonal lines descending from left to right | Follow the wet-bulb line to its labeled scale | Assuming every diagonal line is wet bulb |
| Enthalpy | Diagonal constant-energy lines | Follow the enthalpy line to the enthalpy scale | Using the nearby wet-bulb value as an exact substitute |
| Specific volume | Steep diagonal constant-volume lines | Identify or interpolate the line through the state point | Reporting specific volume as density |
Values between printed lines must be interpolated. The realistic precision is therefore limited by the chart size, line spacing, printing quality, and the reader’s ability to estimate between lines.
Which Two Properties Should You Use?
The best property pair depends on the measurements or design information available. The pair must independently define the moist-air condition at the selected pressure.
Dry Bulb and Relative Humidity
This is the most familiar combination for indoor sensors, weather observations, and general HVAC troubleshooting. Locate the dry-bulb line and the correct RH curve, then mark their intersection.
Dry Bulb and Wet Bulb
This pair is useful when working with sling-psychrometer or aspirated-psychrometer measurements. Confirm that the wet-bulb reading does not exceed the dry-bulb reading.
Dry Bulb and Dew Point
This combination is valuable for condensation analysis. The dew point defines the horizontal humidity-ratio level, while the dry bulb defines the temperature location.
Dry Bulb and Humidity Ratio
This pair is common in HVAC calculations and design documents. Follow the dry-bulb line upward and the humidity-ratio line horizontally to their intersection.
Properties That May Not Be Independent
Dew point and humidity ratio both describe the moisture content at a given pressure, so using only those two values may not independently establish dry-bulb temperature. Relative humidity alone also does not define the air state because the corresponding moisture content changes with temperature.
Reject physically inconsistent inputs before plotting. For ordinary unsaturated air, dew point and wet-bulb temperature should not exceed dry-bulb temperature, and the state point should not fall beyond the saturation curve.
Worked Psychrometric Chart Example
Assume air at standard sea-level pressure has a dry-bulb temperature of 75°F and a relative humidity of 50%. The task is to locate the state point and estimate the remaining properties.
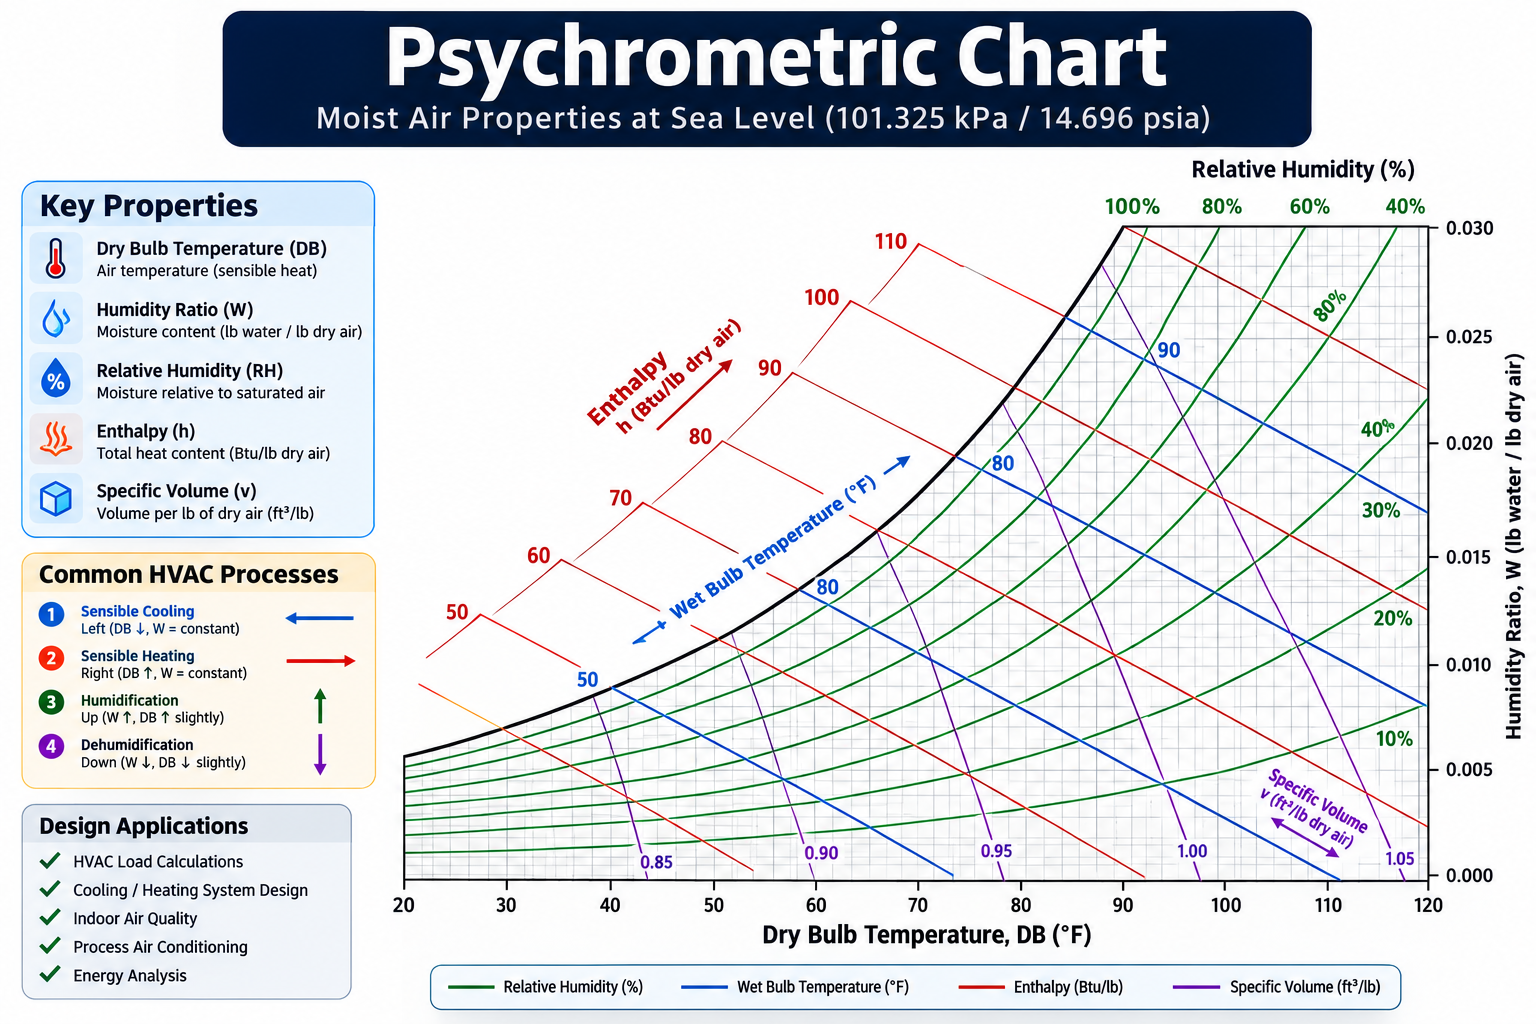
Step 1: Plot the Known Condition
Find 75°F on the dry-bulb scale and follow the corresponding line upward. Locate the 50% RH curve and mark the intersection.
Step 2: Read Humidity Ratio
Move horizontally right from the state point to the humidity-ratio scale. At standard sea-level pressure, a reasonable calculated value is approximately 0.0092 lb water/lb dry air, which is about 65 grains/lb dry air.
Step 3: Read Dew Point
Move horizontally left from the state point to the saturation curve. The corresponding dew-point temperature is approximately 55°F.
Step 4: Read Wet Bulb
Follow the thermodynamic wet-bulb line through the state point to the wet-bulb scale. A chart reading near 62°F to 63°F is reasonable.
Step 5: Read Enthalpy and Specific Volume
Follow the applicable enthalpy line to the enthalpy scale. A reasonable value is approximately 28 Btu/lb dry air. The specific volume is approximately 13.7 ft³/lb dry air.
Enter 75°F dry bulb and 50% relative humidity into the Psychrometric Calculator to compare the calculated properties with the values estimated from the chart.
The dew point and wet bulb should both be below the 75°F dry bulb, and the state point should remain below the saturation curve. Small differences between the image, a printed chart, and the calculator are normal because visual interpolation and calculation methods do not have identical precision.
Psychrometric Chart vs. Psychrometric Calculator
The chart and calculator solve related tasks, but they are most useful in different situations. The chart is best for understanding relationships and process direction. A calculator is better when exact values, pressure corrections, or repeated calculations are required.
Use the Chart When You Need to Visualize
- How air properties relate to one another
- Whether a process adds or removes sensible heat
- Whether moisture content increases or decreases
- How outdoor air and return air mix
- How cooling, dehumidification, reheat, or humidification changes the air state
- Whether a calculated result appears physically reasonable
Use the Calculator When You Need a Number
- Pressure- or altitude-adjusted psychrometric properties
- More precision than a printed chart can provide
- Fast evaluation of multiple operating conditions
- Reliable unit conversions
- A numerical check of a hand-plotted state point
- Values for a downstream load, airflow, or moisture calculation
Use the chart first to understand the state and process, then use the Psychrometric Calculator to calculate and confirm the values needed for the engineering task.
Common HVAC Processes on the Chart
An HVAC process is represented by a line connecting an entering-air state to a leaving-air state. Its direction shows the changes in dry-bulb temperature and humidity ratio.
Sensible Heating
Sensible heating moves to the right at approximately constant humidity ratio. Dry-bulb temperature and enthalpy increase, while relative humidity generally decreases because no water vapor is added.
Sensible Cooling Above the Dew Point
Sensible cooling moves to the left at approximately constant humidity ratio. Dry-bulb temperature decreases and relative humidity increases until the state approaches saturation.
Cooling and Dehumidification
If the cooling surface is below the entering-air dew point, water vapor condenses. The process moves down and left because both dry-bulb temperature and humidity ratio decrease.
The idealized extension of this process toward the saturation curve is associated with the apparatus dew point. The actual leaving-air state depends on coil surface temperature, airflow, heat-transfer area, bypass factor, and operating conditions.
Reheat
Reheat moves horizontally to the right after cooling and dehumidification. Dry-bulb temperature rises while humidity ratio remains approximately constant. This lowers relative humidity without removing additional moisture.
Steam Humidification
Steam humidification raises humidity ratio and normally adds some energy, so the state moves upward and often to the right. The exact direction depends on steam condition, injection method, absorption, and heat losses.
Direct Evaporative Cooling
Direct evaporative cooling generally moves up and left: dry-bulb temperature decreases while humidity ratio increases. Under ideal adiabatic conditions, the process approximately follows a constant wet-bulb or constant-enthalpy direction.
| Process | Typical Direction | Dry Bulb | Humidity Ratio | Common Equipment |
|---|---|---|---|---|
| Sensible heating | Right | Increases | Approximately constant | Heating coil, furnace, electric heater |
| Sensible cooling | Left | Decreases | Approximately constant | Dry cooling coil or heat exchanger above dew point |
| Cooling and dehumidification | Down and left | Decreases | Decreases | Wet cooling coil, DX evaporator |
| Reheat | Right | Increases | Approximately constant | Reheat coil |
| Steam humidification | Up, often slightly right | May increase | Increases | Steam humidifier |
| Direct evaporative cooling | Up and left | Decreases | Increases | Evaporative cooler |
The directions above are idealized. Real equipment paths may deviate because heat and mass transfer are distributed through the device rather than occurring at one uniform condition.
How Air Mixing Appears on a Psychrometric Chart
Outdoor air and return air commonly mix before entering an air-handling unit. Plot both state points on the same pressure-specific chart and draw a straight line between them. For adiabatic mixing without condensation, the mixed-air state lies on that connecting line.
Locating the Mixed-Air State
The location depends on the dry-air mass-flow ratio. The mixed state lies closer to the air stream with the larger dry-air mass flow.
- Plot the outdoor-air state.
- Plot the return-air state.
- Draw a straight line between the two points.
- Determine the dry-air mass-flow fraction of each stream.
- Locate the mixed-air point along the connecting line.
- Read or calculate the mixed-air properties.
Simple Mixing Interpretation
If a system uses 20% outdoor air and 80% return air by dry-air mass, the mixed point will be much closer to the return-air state than the outdoor-air state. It will not normally sit at the geometric midpoint of the line.
Damper position is not necessarily equal to outdoor-air mass-flow percentage. Leakage, pressure differences, fan operation, density, and damper characteristics can shift the actual mixed-air condition.
What a Psychrometric Chart Is Used For
Cooling-Coil Analysis
Plot entering and leaving air to separate sensible cooling from latent moisture removal. The humidity-ratio change indicates condensate removal, while the enthalpy change supports total cooling-load calculations.
Condensation and Dew-Point Checks
Compare air dew point with the temperature of ducts, pipes, diffusers, windows, roof decks, chilled-water components, or other surfaces. Condensation can occur when a surface is below the surrounding air’s dew point.
Use the Dew Point Calculator when the main task is comparing an air condition with a known surface temperature.
Ventilation and Outdoor-Air Loads
Plot outdoor, return, mixed, and supply-air states to see how ventilation affects sensible load, latent load, coil operation, and dehumidification requirements.
Humidity-Control Design
Humidity ratio shows the actual moisture content more directly than relative humidity. This distinction is important for humidifiers, dehumidifiers, drying systems, process spaces, and buildings with high latent loads.
Evaporative Cooling Systems
The chart shows the theoretical relationship between dry-bulb reduction and humidity-ratio increase. It also shows why evaporative cooling capacity is strongly influenced by the entering wet-bulb temperature.
Air-System Energy Analysis
Enthalpy differences can be combined with dry-air mass flow to estimate the total energy transferred to or from an air stream. Final calculations require consistent units and an appropriate mass-flow basis.
Do not use a visual chart reading as the sole basis for final equipment selection, code compliance, laboratory calibration, critical humidity control, or warranty-sensitive design. Confirm final values with project-specific calculations and equipment data.
Common Psychrometric Chart Mistakes
Use this checklist before accepting a chart result.
- Wrong chart pressure: A sea-level chart can produce misleading properties at higher elevations.
- Wrong unit scale: Confirm °F versus °C, Btu/lb versus kJ/kg, and lb/lb versus grains/lb or g/kg.
- Relative humidity confused with moisture content: RH can change even when humidity ratio remains constant.
- Dew point traced in the wrong direction: Move horizontally to the saturation curve, not diagonally.
- Wet bulb confused with enthalpy: The lines may be close, but they represent different properties.
- Specific volume confused with density: Specific volume is volume per unit dry-air mass.
- Dependent properties selected: Two values that describe the same moisture condition may not uniquely establish the full state.
- Impossible state accepted: Wet bulb or dew point above dry bulb usually indicates inconsistent inputs.
- Excessive precision reported: A hand-read chart value should not be reported with more precision than the chart supports.
- Ideal process assumed for real equipment: Coils, humidifiers, and evaporative devices have finite effectiveness and nonuniform operating conditions.
Seven-Point Chart QA Checklist
- Pressure: Does the chart match the site pressure or altitude?
- Units: Are all chart scales and input units understood?
- Inputs: Are the two known properties independent?
- Physics: Are the inputs physically consistent?
- Line family: Did you follow the correct axis, curve, or diagonal?
- Process direction: Does the movement match the expected heat and moisture transfer?
- Precision: Is the result reported as an appropriate estimate?
When any of these checks are uncertain, repeat the condition in the Psychrometric Calculator before using the result in another engineering calculation.
Psychrometric Chart Engineering References
These sources support the moist-air properties, chart construction, pressure dependence, and HVAC process descriptions used on this page.
- ASHRAE Handbook—Fundamentals, Chapter 1: Psychrometrics Primary technical reference for moist-air properties, psychrometric charts, pressure-specific charts, line geometry, and air-conditioning processes.
- ASHRAE Psychrometrics Resources Official chart, software, publication, unit-system, state-point, and process-analysis resources.
- Penn State Extension: Psychrometric Chart Use Educational explanation of chart axes, boundaries, moist-air properties, state points, and practical chart reading.
Frequently Asked Questions
A psychrometric chart is used to find moist-air properties and visualize HVAC processes including heating, cooling, humidification, dehumidification, evaporative cooling, reheat, air mixing, and cooling-coil operation.
Two independent properties are needed at a known atmospheric pressure. Common pairs include dry bulb and relative humidity, dry bulb and wet bulb, dry bulb and dew point, or dry bulb and humidity ratio.
Move horizontally left from the state point along a constant humidity-ratio line until reaching the 100% relative-humidity saturation curve. The temperature at the intersection is the dew point.
Yes. Altitude changes atmospheric pressure, which changes humidity-ratio, specific-volume, enthalpy, and other property relationships. Use a chart or calculation matched to the applicable pressure.
Use a chart to understand property relationships and HVAC process direction. Use the Psychrometric Calculator when you need faster, pressure-adjusted, or more precise numerical property values.
Summary and Next Steps
To read a psychrometric chart, first select the correct pressure and unit system. Plot two independent properties, mark their intersection, and follow the appropriate line families to find the remaining moist-air properties.
For HVAC process analysis, connect the entering and leaving states and check whether the direction matches the expected temperature and moisture changes. Use calculated values when pressure correction, equipment selection, or precise energy and moisture balances are required.
Use the Psychrometric Calculator to enter known air conditions, calculate the remaining properties, account for pressure or altitude, and verify values read from the chart.
Where to Go Next
-
Psychrometric Calculator
Calculate moist-air properties from dry-bulb temperature and a second known property, verify chart readings, and account for pressure or altitude.
-
Dew Point Calculator
Calculate dew point for condensation-risk and surface-temperature comparisons.
-
Types of HVAC Systems
Learn how common HVAC system configurations apply heating, cooling, ventilation, and humidity-control processes.